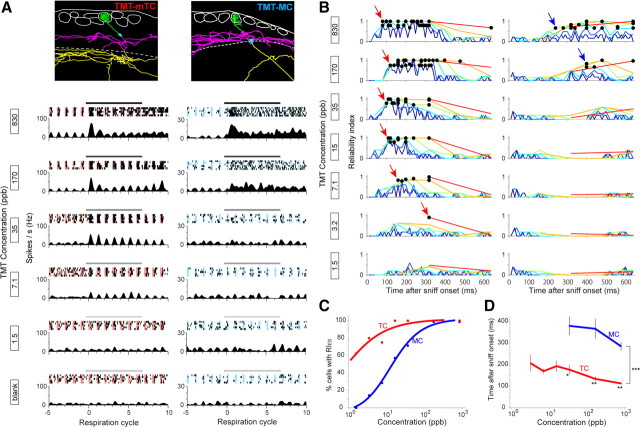
Figure 3.
Short-onset latencies of tufted cells were maintained over a wide range of odor concentration series. A, Top, Morphological reconstruction of a middle TC (TMT-mTC) (left) and MC (TMT-MC) (right) that responded to TMT. Layer structure is shown as in Figure 2A. Bottom, Raster plots of spike discharges and peristimulus-phase histograms of the mTC and MC in response to stimulation (black bar, 4 s) with different concentrations of TMT (830–1.5 ppb, from top to bottom). B, Plot of RI of the mTC (left) and MC (right) shown in A in response to TMT concentration series (830–1.5 ppb, from top to bottom). RI was plotted using six different temporal bins as in Figure 2. C, Proportion of MCs (blue; n = 7) and TCs (red; n = 8) that exhibited statistically significant RI in odor concentration series. The lines indicate logistic fitting of the plots. D, Bin position that exhibited the earliest significant RI (RIES) in MC (blue; n = 7) and TC (red; n = 8) populations in the TMT concentration series. RIES emerged faster in TCs than MCs at all concentrations. Note that only concentrations at which more than two-thirds of MCs demonstrated RIES are plotted, and most MCs did not demonstrate RIES at low concentrations. *p < 0.01 (t test), **p < 0.001 (t test), ***p < 1.0e-12 (ANOVA).

