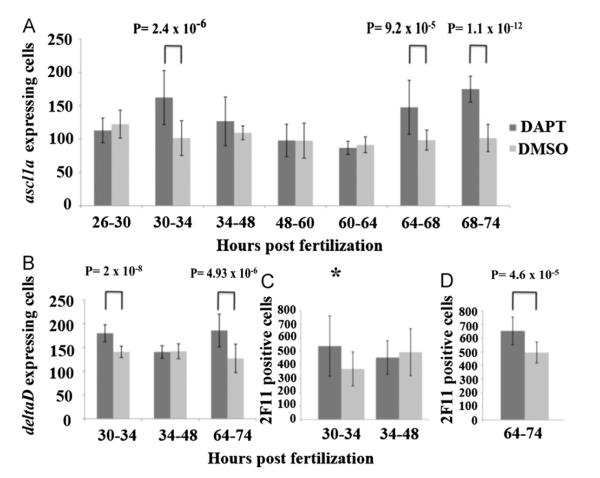
Fig. 6.
Effects of inhibition of Notch signaling within the intestinal epithelium. Embryos from three independent experiments were exposed to the gamma-secretase inhibitor DAPT, or DMSO as a control, for 4–14 h periods followed by washout and return to embryo media. Embryos were then assayed for increases in the number of ascl1a (A), deltaD (B) (by RNA in situ hybridization), or 2F11 (using immunohistochemistry). (C) expressing cells throughout the entire intestine at 74 hpf. For ascl1a and deltaD RNA in situ hybridization, the yolk was removed and intestinal cells were counted. Embryos were assayed (D) for increases in secretory cells (2F11) after Notch inhibition between 64 and 74 hpf and at 96 hpf instead of at 74 hpf. In panels A through (C), a two-way analysis of variance showed a significant difference between time and DAPT inhibition; (A) F(6,238)=16.162, p=0.00, (B) F(2,96)=15.504, p=0.00, (C) F(1,56)=5.086, p=0.028. In post-hoc tests, either equal or unequal variances were identified using the Fisher test and the appropriate T test was utilized (equal or unequal variances). Two-tailed student T tests with unequal variances (Welch’s T test) are used for 30–34 hpf, 34–48 hpf, and 64–68 hpf in panel (A) while the rest have equal variances. p values from the appropriate T test are indicated above the time periods with a significant difference when compared to DMSO control group after Bonferroni correction ((A) p<0.0071; (B) p<0.0167; (C) p<0.025). While the p value for 30–34 hpf in panel (C) (p=0.029) is not significant using the Bonferroni correction, the value is just above the level of significance p<0.025) and labeled with an asterisk to indicate a trend of increased numbers of secretory cells. Each of the other time periods do not result in significantly different values when compared to the DMSO controls. Black lines on bars represent standard deviation. Total number of individuals tested from each of the three independent experiments are as follows; Panel (A) 26–30 DAPT: n=22, DMSO: n=21 30–34 DAPT: n=20, DMSO: n=23 34–48 DAPT: n=20, DMSO: n=14 48–60 DAPT: n=14, DMSO: n=17 60–64 DAPT: n=14, DMSO: n=18 64–68 DAPT: n=18, DMSO: n=15 68–74 DAPT: n=20, DMSO: n=16 Panel (B) 30–34 DAPT: n=15, DMSO: n=18 34–48 DAPT: n=16, DMSO: n=17 64–74 DAPT: n=19, DMSO: n=17 Panel (C) 30–34 DAPT: n=20, DMSO: n=11 34–48 DAPT: n=15, DMSO: n=14 Panel (D) 64–74 DAPT: n=15, DMSO: n=15.

