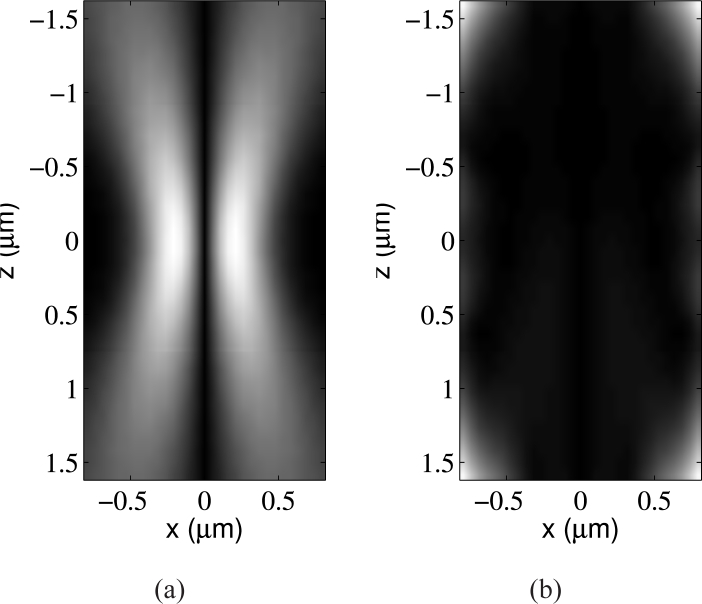
Fig. 5.
The distribution of the error on the measurement (xz) plane for the FDTD parameters in the rightmost column of Table 2. (a) The ∞-norm of the theoretical incident field. (b) The ∞-norm of the error. The grayscale upper limit is 1/10th of that in (a) for accentuation. The error is seen to be concentrated at the corners of the plane.

