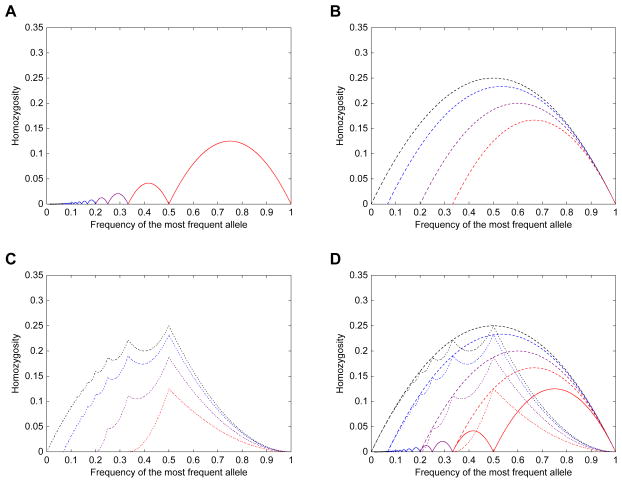
Figure 7.
The difference between the upper and lower bounds on homozygosity, for a given frequency of the most frequent allele, and the difference between the frequency of the most frequent allele and the bounds. (A) M − UHK(M). (B) M − LHK(M). (C) UHK(M) − LHK(M). (D) Superposition of parts (A), (B), and (C). Plots for loci with K = 3, K = 5, and K = 15 alleles appear in red, purple, and blue, respectively, each with domain [1/K, 1). The case of unspecified K is plotted in black, with domain (0, 1).

