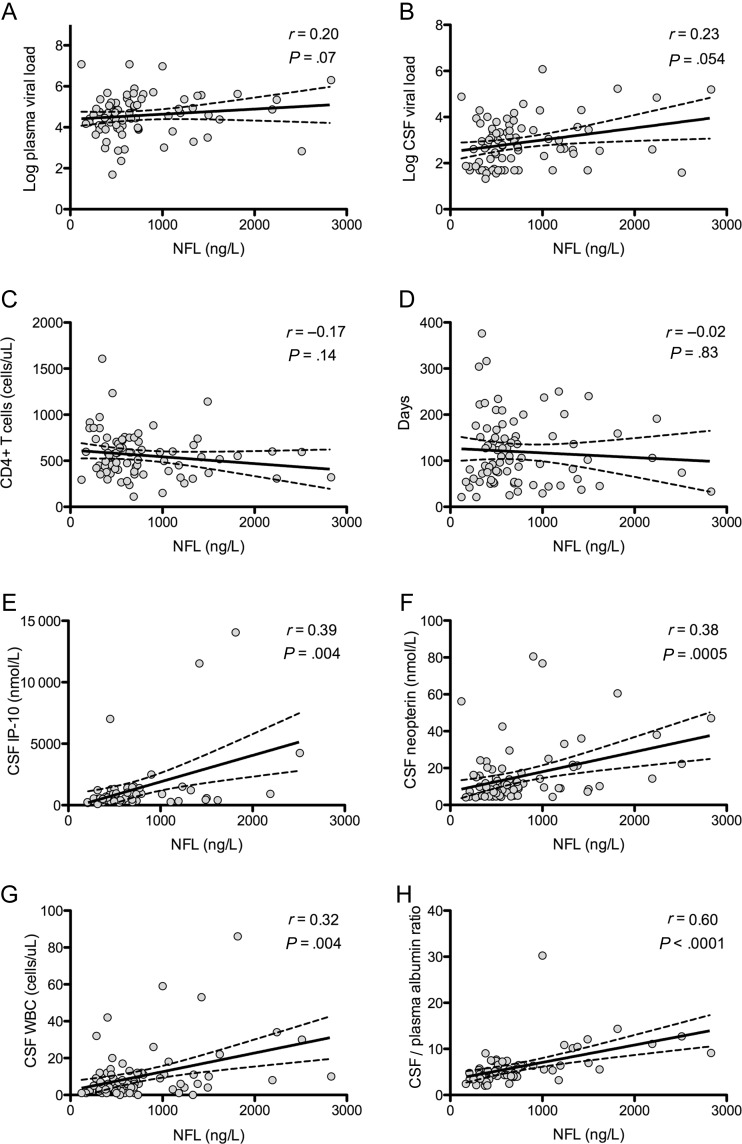
Figure 2.
A–H, Correlates of neurofilament light chain levels in primary human immunodeficiency virus infection. r represents the Spearman correlation coefficient and corresponding P value. Solid lines represent best-fit regression line, and dashed lines represent 95% confidence intervals. Abbreviations: CSF, cerebrospinal fluid; IP-10, interferon gamma-induced protein 10; NFL, neurofilament light chain; WBC, white blood cell.

