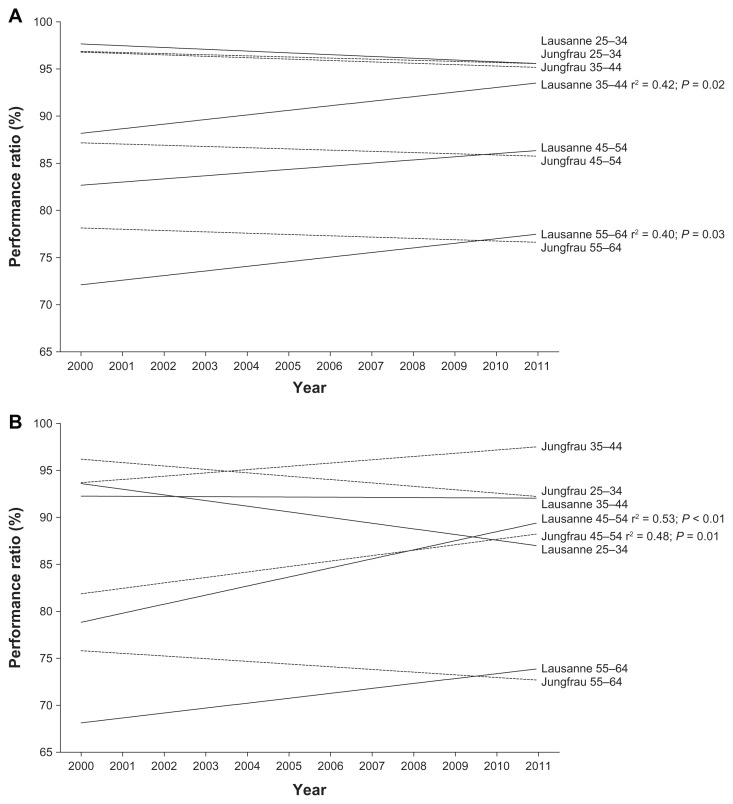
Figure 5.
Changes in the performance ratio per age group per sex across the years. (A) Women; (B) Men.
Notes: Performance ratio is expressed as the percentage of performances of the overall top ten athletes in their respective marathon years. r2 and P-values are indicated in the case of a significant change in performance ratio over time.

