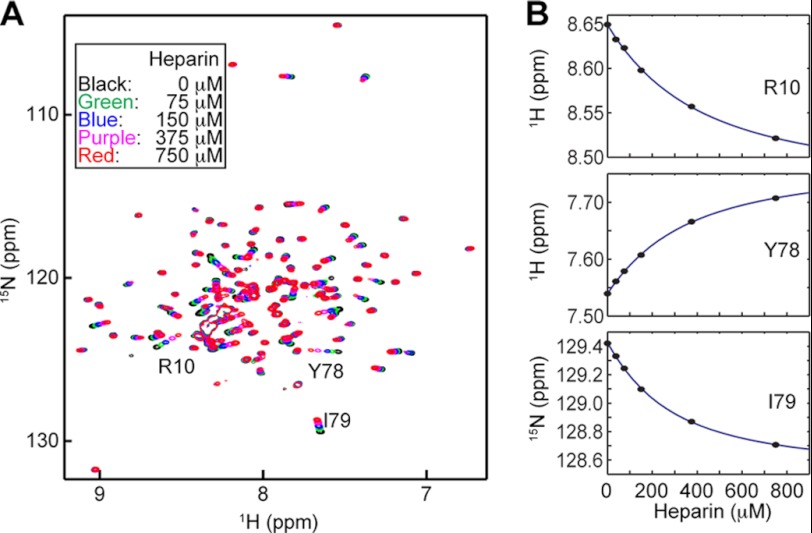
FIGURE 5.
HMGB1/heparin interactions observed by NMR. A, 1H-15N transverse relaxation optimized spectroscopy spectra recorded at 37 °C for 135 μm all-thiol HMGB1 in the presence of heparin octasaccharide at different concentrations. The samples were dissolved in 20 mm Tris-HCl (pH 7.5), 120 mm NaCl, and 5 mm DTT. B, determination of the dissociation constant (Kd) from 1H and 15N chemical shifts as a function of heparin concentration. The titration data, together with the best fit curves, are shown for three residues whose signals are indicated in A. Fourteen signals from residues showing large chemical shift perturbation were analyzed, from which the Kd was determined to be 259 ± 72 μm.

