
TABLE 1.
Protein abundance changes between exosomes from CD81 knock-out mice as compared with exosomes obtained from wild type animals
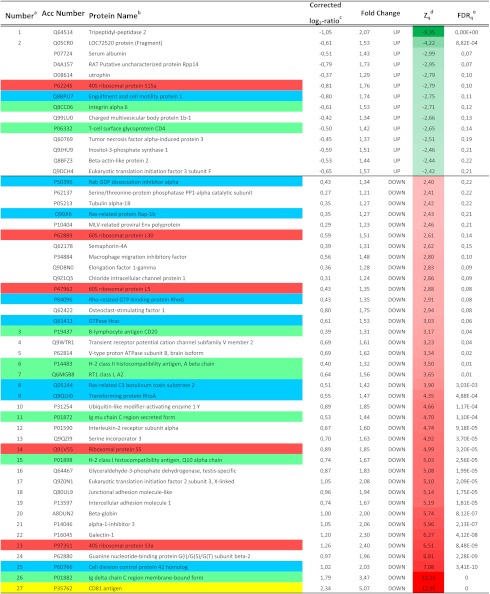
a Proteins showing statistically significant abundance changes are numbered as in Fig. 5B.
b Proteins belonging to some selected ontological categories are colored using the same set of colors as in Fig. 5B.
c Log2 ratios were corrected by subtracting the grand mean value.
d Standardized normal values were obtained by dividing protein log2 ratios by their variance. Only proteins with |Zq| ≥ 2.4 are listed. Data are colored according to the color scales on the bottom.
e False discovery rate of quantification at the protein level.