FIGURE 5.
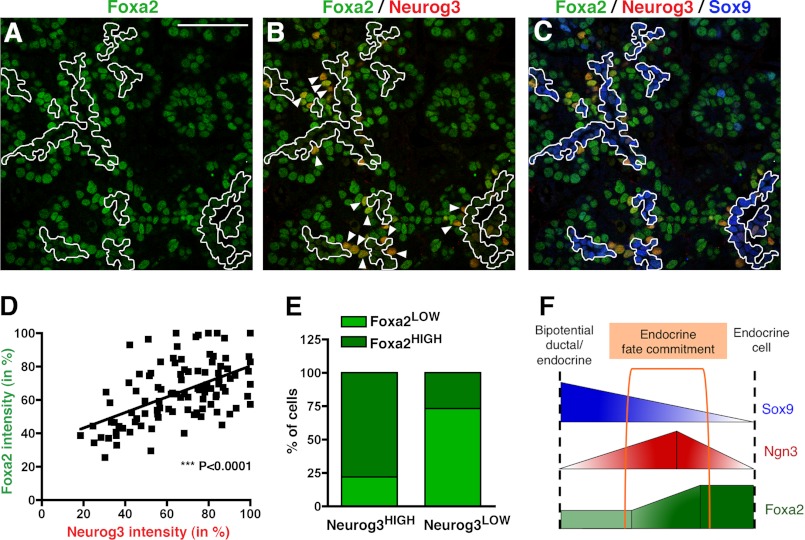
Co-expression of Foxa2 and Neurog3 in the mouse embryonic pancreas by immunofluorescence. Staining for Foxa2 is shown alone (green, A), with Neurog3 (red, B), or with Neurog3 (red) and Sox9 (blue, C) at E15.5. D, linear regression analysis and (E) bar graph displaying the positive correlation between Neurog3 and Foxa2 expression levels. The signal intensities were normalized for each channel to the maximum intensity (100%) for each of the images. F, diagram depicting the conclusions from the expression analysis in vivo. Cells from the bipotential ductal/endocrine cells that adopt and endocrine cell fate are Neurog3HIGH/Foxa2HIGH/Sox9LOW/−. Arrowheads in B indicate Neurog3HIGH cells lying outside of the Foxa2LOW/Sox9HIGH cell domain lining the ducts (outlined). Scale bar: 50 μm.

