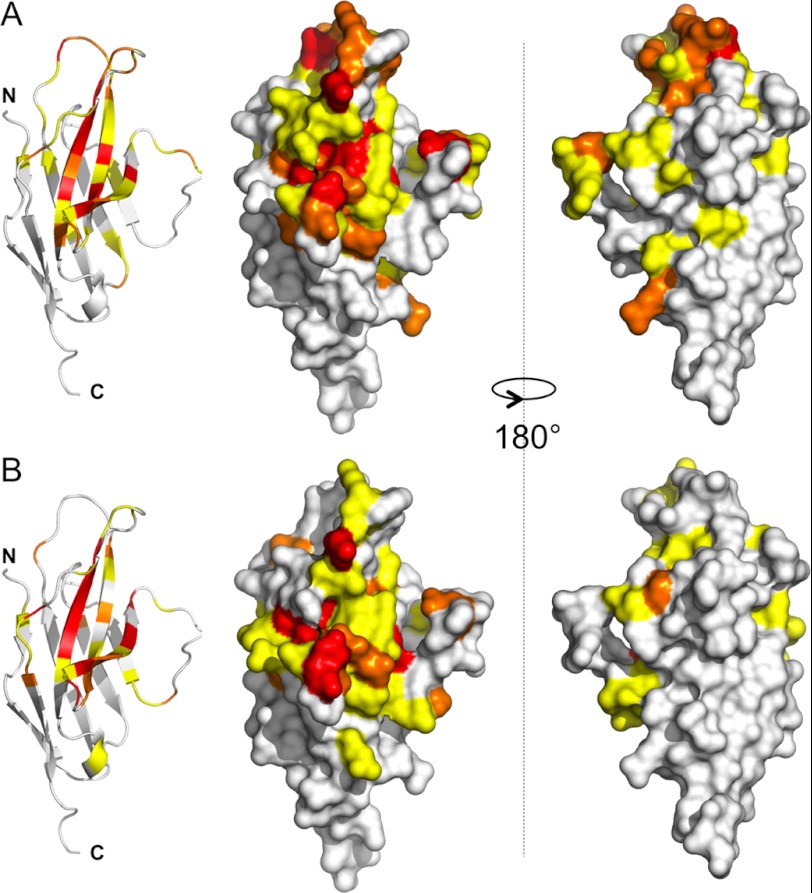
FIGURE 3.
Regions of hPD-1 affected by PD-L1/PD-L2 binding. A, schematic and surface views of hPD-1 in which residues are colored according to the perturbation of their backbone (15N, 13C′, and 1HN) signals induced by hPD-L1 binding. Residues highlighted in B indicate the areas in hPD-1 affected by hPD-L2 binding. The color scheme used is relative for each complex (residues with minimal shift values lower than the S.D. value for the whole set are represented in white, residues with minimal shift values of >1 × S.D. are shown in yellow, residues with minimal shift values of >1.5 × S.D. are shown in orange, and residues with minimal shift values of >2 × S.D. are in red). Two views rotated by 180° are shown.

