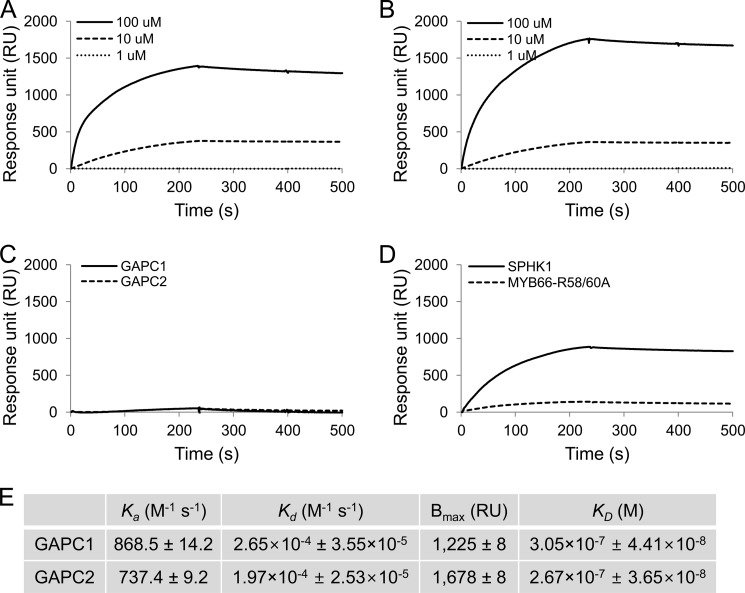
FIGURE 4.
SPR quantitative analysis of PA-GAPC interaction. His-tagged proteins (0.2 μm) were first immobilized on the nitrilotriacetic acid chip followed by injection of liposomes containing PC only or PC plus PA. The representative sensorgrams show RU values at different liposome concentrations over time starting with the time point that liposomes were injected (0 s). Liposome injection was stopped at 235 s. A–D, PA-GAPC1 (A), PA-GAPC2 (B), PC (100 μm)-GAPC1/GAPC2 (C), PA (100 μm)-SPHK1/Myb (D). E, summary of kinetic constants for the PA-GAPC interaction. Values were averaged from three independent assays and are shown ± S.E.

