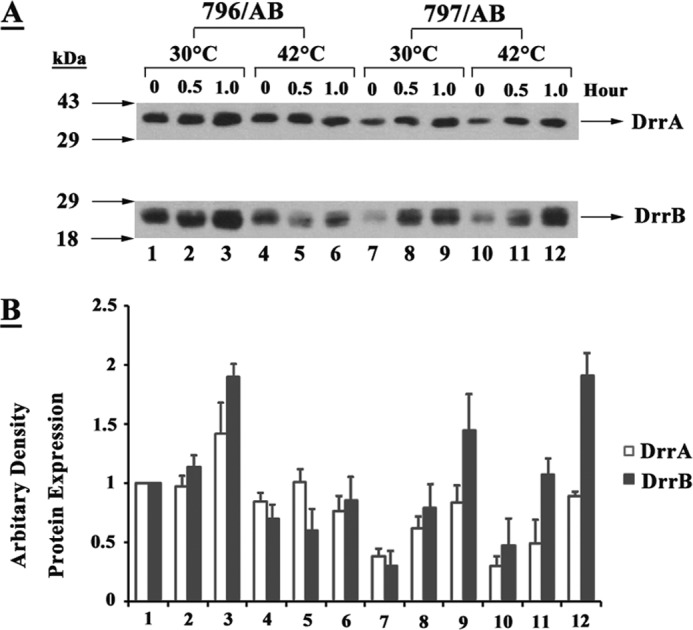
FIGURE 5.

FtsH promotes assembly of the DrrAB complex. A, E. coli 796 or 797 cells expressing DrrAB were grown at 30 °C to mid-log phase and the culture was divided into two halves. One-half was induced with 0.25 mm IPTG at 30 °C (lanes 1–3 for 796 and lanes 7–9 for 797) and the other half was induced at 42 °C (lanes 4–6 for 796 and lanes 10–12 for 797). Aliquots of each sample were collected at 30-min intervals. Hours of induction are shown at the top of the gel. 0 h represents A600 nm = 0.6 at which time IPTG was added. Western blot analysis was carried out as described in the legend to Fig. 1A. B, quantitative analysis of DrrA and DrrB. The intensity of bands on the nitrocellulose membrane was determined by densitometric scanning. The intensity of DrrA and DrrB in lane 1 was designated as 1. The data represent an average of 3 experiments.
