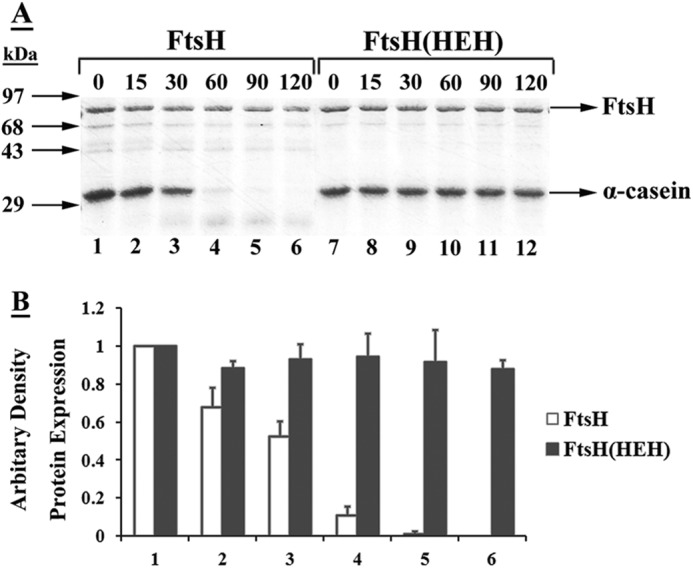
FIGURE 6.

In vitro digestion of α-casein by purified FtsH or FtsH(HEH). A, α-casein was mixed with purified wild-type FtsH or FtsH(HEH) protein in the protease buffer as described under “Experimental Procedures.” The samples were analyzed by 12% SDS-PAGE, followed by Coomassie Brilliant Blue staining. B, quantitative analysis of the amounts of α-casein. The intensity of the bands on the nitrocellulose membrane was determined by densitometric scanning. The intensity of α-casein in lane 1 was designated as 1. The intensities represent an average of 3 experiments.
