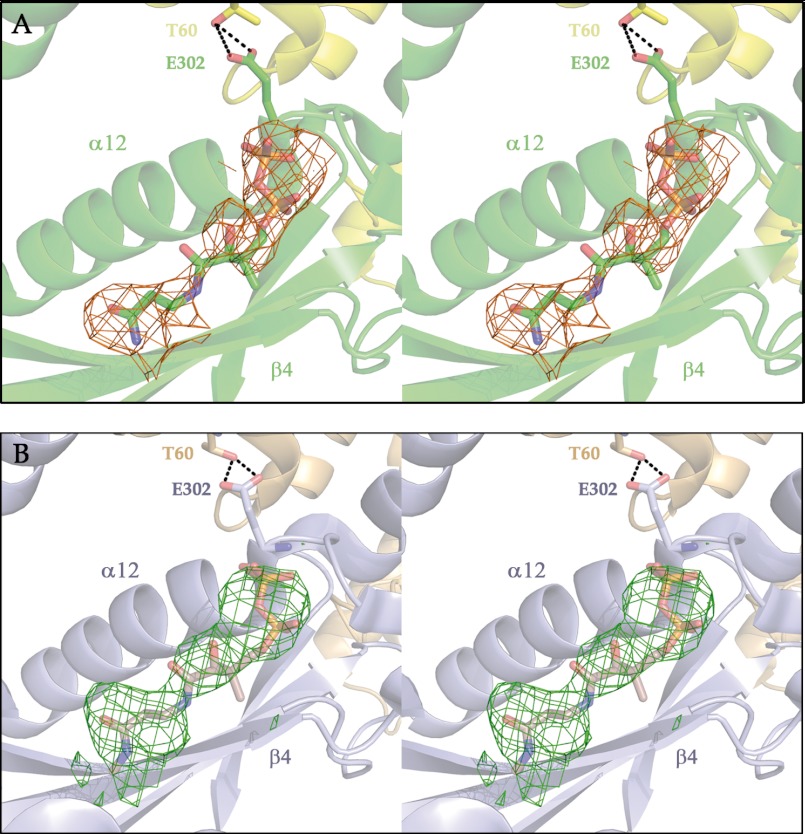
FIGURE 5.
Ligands in the active centers of subunits with the B conformation. Shown are stereo views of Fo − Fc difference electron density maps for the active centers of MCD subunits presenting the B conformation. A, for MCD (Protein Data Bank code 4F0X). B, for mMCD (code 2YGW). Density corresponds to unidentified ligands, which have been represented with the pantetheine and pyrophosphate moieties of a CoA molecule according to the superimposition shown in Fig. 4B.

