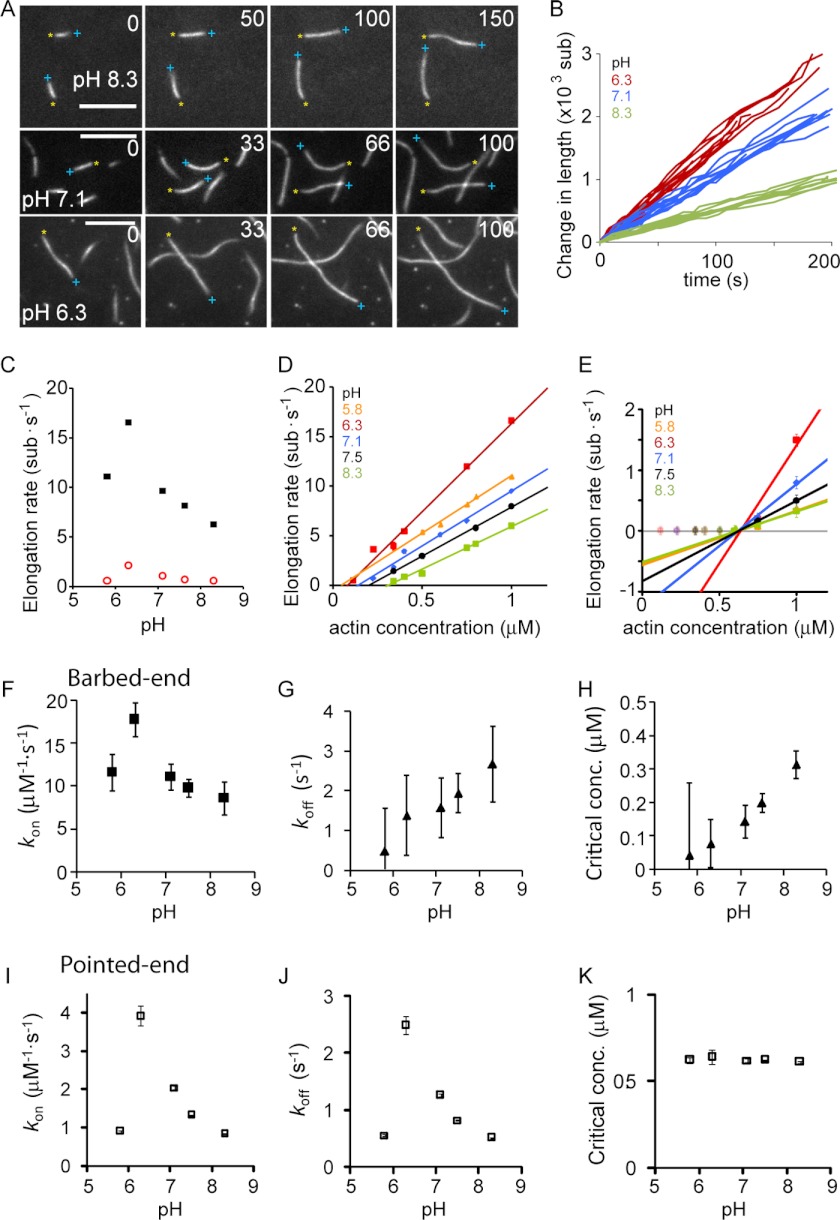
FIGURE 5.
Dependence of actin filament elongation kinetics on pH. A, individual filaments (30% atto488-labeled) monitored with time using TIRFM at pH 8.3, 7.1, and 6.3. Barbed ends are marked by a blue plus sign, and pointed ends are marked by a yellow asterisk. All scale bars are 5 μm. B, change of filament length versus time for different filaments measured at the indicated pH values. C, elongation rate of barbed end and pointed end at 1 μm versus pH. Error bars are S.E. D, barbed-end elongation rate versus actin concentration for various pH values. E, pointed-end elongation rate versus actin concentration for various pH values. Only concentration points above 600 nm were used to estimate rate constants (see supplemental material for fits using all data points). F–H, rate constants of barbed-end elongation versus pH as follows: association rate (F), dissociation rate (G), and critical concentration (H). I–K, rate constants of pointed-end elongation versus pH as follows: association rate (I), dissociation rate (J), and critical concentration (K). F–K, error bars were determined from the propagation of errors from the linear fits of the data presented in D and E. At least 25 filaments were measured per condition.

