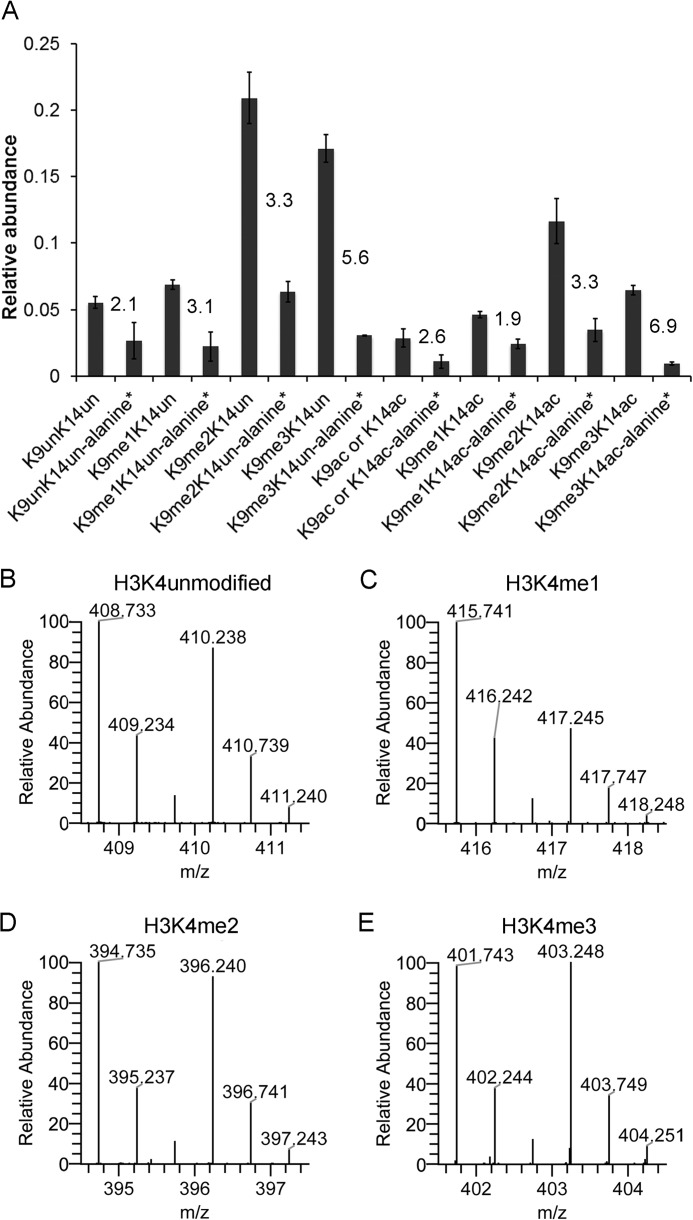
FIGURE 5.
Estimating the lag between histone synthesis and lysine modification. HEK293 cells were cultured with [13C]glucose for 24 h, and the histones were analyzed by nanoLC-MS. The intensities of each modified form of the peptide K9STGGK14APR were calculated for unlabeled alanine and labeled alanine (+3 Da). A, intensity values were used to create a relative abundance (1 = 100%) of both unlabeled and labeled modified forms. The numbers on the graph indicate the ratio of unlabeled to labeled. The relative abundance of unlabeled and labeled modifications on H3K4 (B–E) is plotted. B–E represent [M + 2H]+2 spectra.

