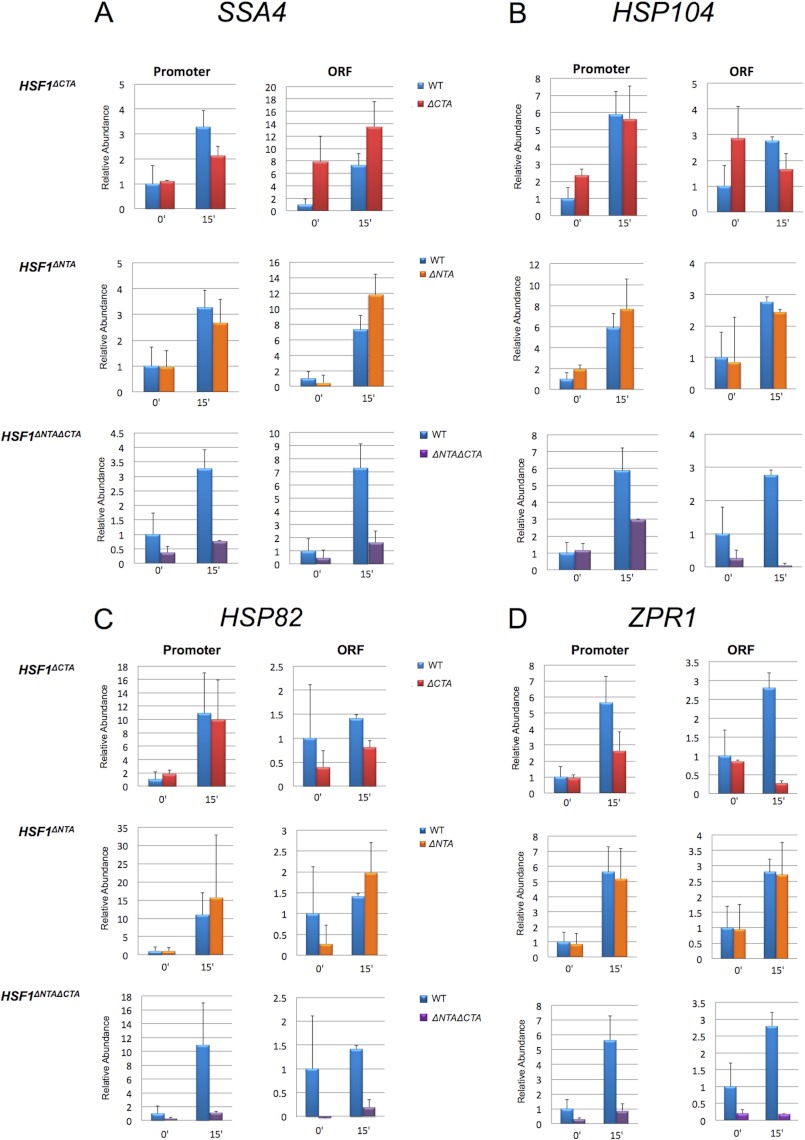
FIGURE 8.
Pol II occupancy of HSP genes in HSF1+, HSF1ΔCTA, HSF1ΔNTA, and HSF1ΔNTAΔCTA strains. A, Pol II occupancy of the SSA4 promoter and ORF either prior to or following a 15-min heat shock. Pol II ChIP analysis was conducted and quantified as described in the legend to Fig. 6. Depicted are means ± S.D. (error bars); n = 3. Note that the extracts used for this analysis were the same as those used for the Hsf1 and Med4-TAP ChIP assays presented in Fig. 7. B–D, Pol II occupancy of the HSP104, HSP82, and ZPR1 promoter and ORF regions as in A.

