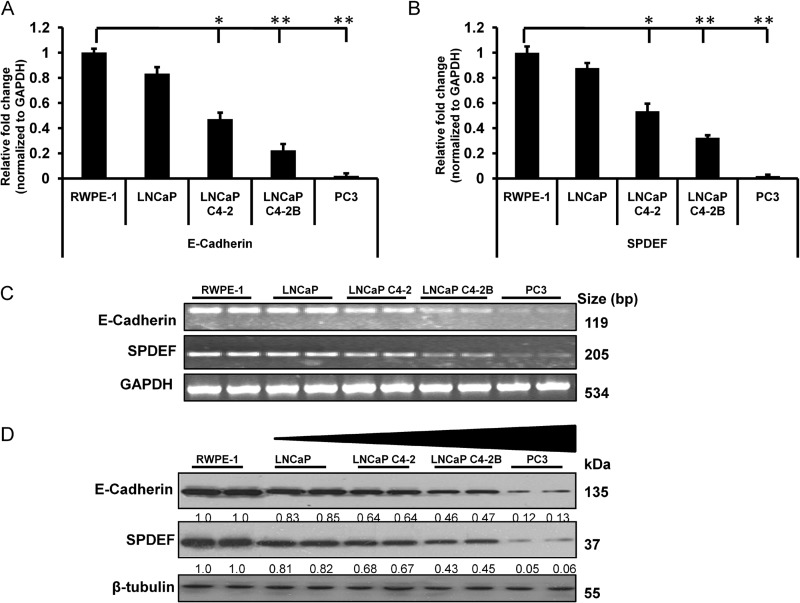
FIGURE 1.
Direct correlation between expression of E-cadherin and SPDEF in prostate cancer cells. A and B, gene expression profiles of E-cadherin (A) and SPDEF (B) were measured by qRT-PCR. C, E-cadherin and SPDEF at mRNA level as assessed by semiquantitative reverse transcription-polymerase chain reaction. D, a representative Western blot shows that the expression of SPDEF and E-cadherin significantly decreased in the order of increasing metastatic property of tested cell lines LNCaP, LNCaP C4-2, LNCaP C4-2B, and PC3 compared with nontumorigenic human prostate epithelial cells, RWPE-1. *, p < 0.05; **, p < 0.005.

