. 2013 Jan-Feb;17(1):21–24. doi: 10.4103/0972-124X.107469
Copyright: © Journal of Indian Society of Periodontology
This is an open-access article distributed under the terms of the Creative Commons Attribution-Noncommercial-Share Alike 3.0 Unported, which permits unrestricted use, distribution, and reproduction in any medium, provided the original work is properly cited.
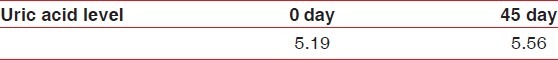
Table 3.
Comparison of uric acid levels of Group 1 on 0 and 45th day