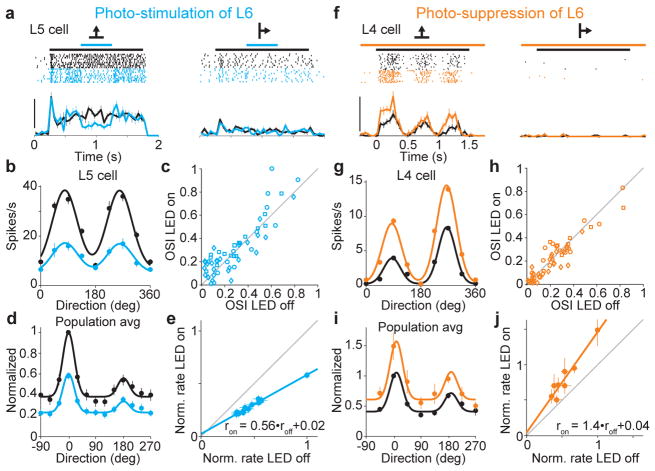
Figure 2. L6 bidirectionally modulates gain of visual responses without altering tuning.
a. Visual responses of L5 neuron (2 of 8 tested directions) with (blue) and without (black) L6 photo-stimulation. Scale bar, 40 spikes/s.
b. Tuning curves for neuron in (a).
c. Orientation selectivity index (OSI) for each neuron with and without photo-stimulation of L6.
d. Population tuning curve with (blue) and without (black) L6 photo-stimulation (n = 55). Black curve: fit using sum of two gaussians. Blue curve is black curve scaled by slope of linear fit in (e).
e. Control response plotted against response with L6 photo-stimulation (data from c). Linear fit (blue; r2 = 0.98).
f. Visual response of L4 neuron with (orange) and without (black) L6 photo-suppression. Scale bar, 50 spikes/s.
g. Tuning curves for neuron in (f).
h. OSI for each isolated unit with and without photo-suppression of L6.
i. Population tuning curves with and without L6 photo-suppression (n = 52). Black curve: fit using sum of two gaussians. Orange curve is black curve scaled by slope of linear fit in (j).
j. Control response plotted against response with L6 photo-stimulation (data from i). Linear fit (orange; r2 = 0.92).

