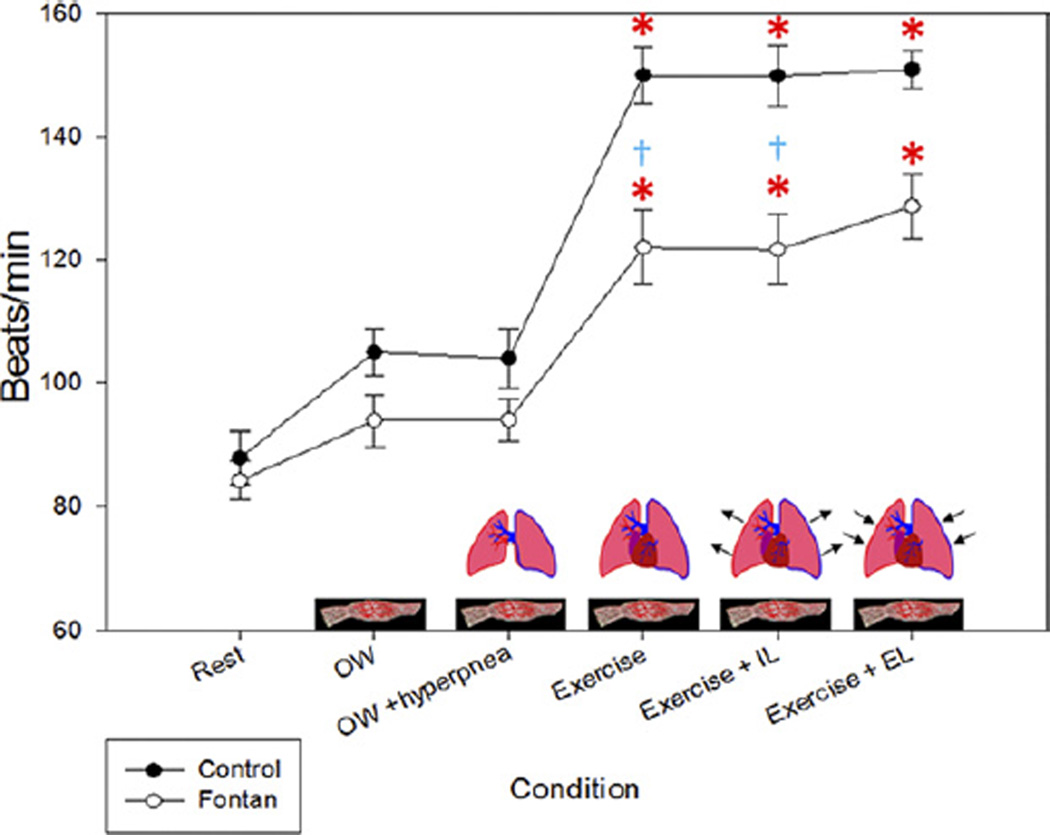
Figure 3. Heart Rate.
The change in heart rate mimics the change seen in oxygen uptake. The heart rate change was minimal in the Fontan patients with zero-resistance cycling (0W) but increased in the controls in this condition. EL = expiratory load; IL = inspiratory load. *p < 0.05 compared with baseline (rest) within groups; †p < 0.05 between groups within condition.

