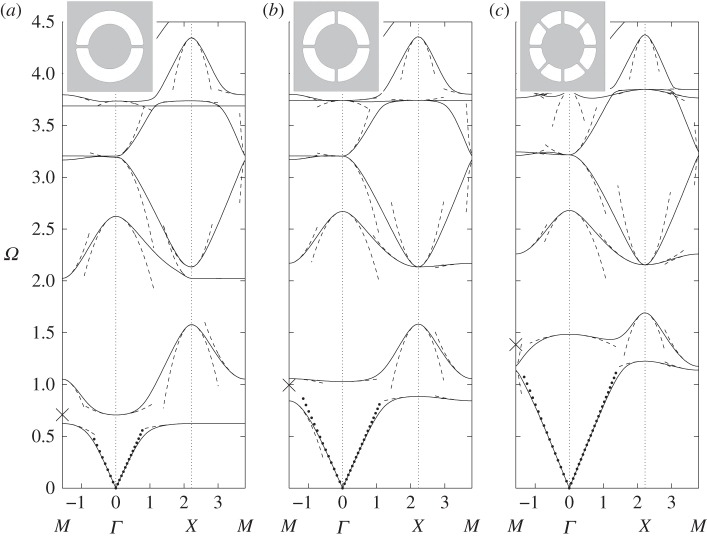
Figure 4.
The dispersion diagram shown for an array of square cells (side 2) containing circular holes of radius 0.8, and with circular inclusions of radius 0.5, attached to the rest of the cell by two, four and eight thin ligaments in (a–c), respectively. The dispersion curves from numerics are shown as solid lines, the asymptotic HFH results are shown as dashed lines, with the low-frequency linear classical homogenization shown dotted emerging from the origin. The thin ligament approach of §4a gives estimates for the first non-zero eigenvalue at Γ, which are the crosses on the frequency axis. Numerical values for these estimates are 0.7082, 0.9941, 1.3851 versus finite-element simulations of 0.7058, 1.0281, 1.4845 for two, four and eight ligaments, respectively. The sixth mode of figure 4b is flat at frequency 3.741 and corresponds to the dipole mode described in §4 with approximate frequency 3.6824.

