
Figure 3.


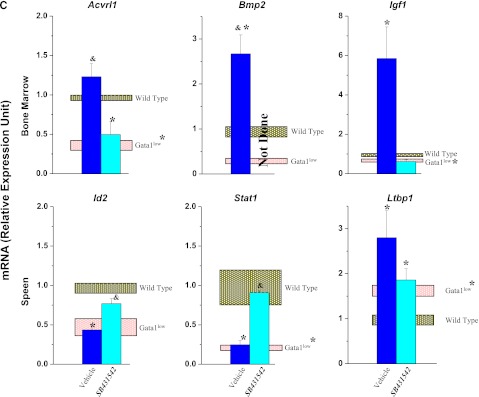
Unique altered expression signatures characterize the TGF-β pathway profiles of BM and spleen of Gata1low mice. (A) Hierarchical clustering of normalized gene expression in BM and spleen from untreated wild-type and Gata1low mice and from Gata1low treated with either vehicle or SB431542, as indicated (each line a different mouse, 3 mice per experimental group). (B) Venn diagram depicting overlap of differentially expressed genes in BM and spleen of untreated Gata1low mice or in Gata1low mice treated with either vehicle or SB431542, as indicated. Only genes with ≥ 2-fold differences in expression levels were considered. For further details, see Table 3. (C) Quantitative RT-PCR determinations of the mRNA levels for Acvrl1, Bmp2, and Igf1 in BM and of Id2, Stat1, and Ltbp1 in spleen of untreated wild-type and Gata1low mice and of Gata1low mice treated with either vehicle or SB431542, as indicated. Results are normalized to those observed in wild-type mice and are presented as mean (±SD) of those observed, with 3 mice per experimental group. Values statistically different (P < .05) from those observed in wild-type or untreated Gata1low mice are indicated with * or &. Differences in gene expression among the 4 experimental groups are similar to those observed by microarray analyses.