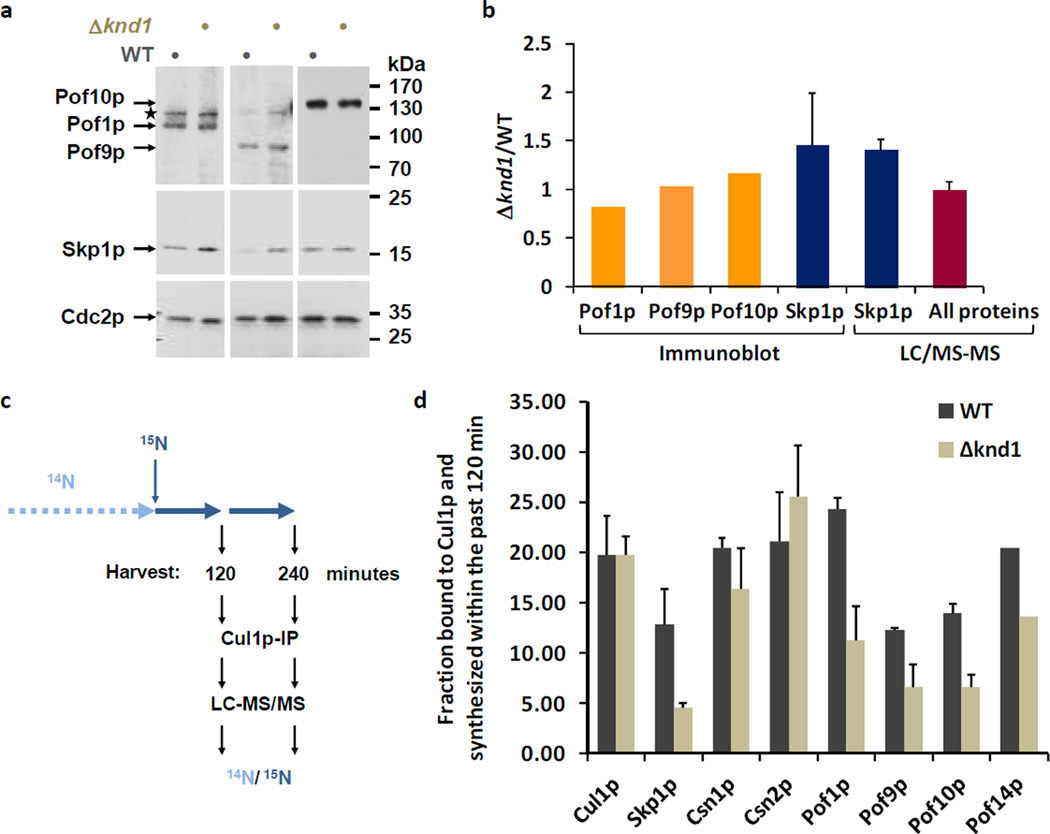
Figure 2. Effect of Knd1p on CRL1 dynamics.
(a) Steady-state levels of FBPs in WT and Δknd1 cells. The expression of Pof1p, Pof9p, and Pof10p modified with c-Myc epitopes at the endogenous genomic locus was determined by immunoblotting with Myc antibodies. Blots were reprobed with anti-Skp1p and anti-Cdc2p (PSTAIR) antibodies as a reference.
(b) The first 3 bars show a quantification of the FBP ratios in Δknd1 versus WT cells apparent from the immunoblots in (A) as determined by film densitometry. Ratios are from values normalized to Cdc2p. The fourth bar shows the average Skp1p ratio obtained from 4 independent immunoblot measurements including standard deviation. The fifth bar shows the Δknd1/WT ratio of Skp1p quantified by LC-MS/MS. Skp1p was immunopurified independently four times from 1:1 mixtures of 15N (WT) and 14N (Δknd1) labeled cells. The average ratio and the standard deviation were plotted. The sixth bar shows the average ratio of all proteins identified in the Skp1p purification. The ratio of these background proteins was close to 1.0 with a narrow standard deviation, supporting the significance of the ~1.5-fold increase in Skp1p levels in Δknd1 cells.
(c) Schematic outline of the 15N pulse labeling strategy. Cells maintained in routine 14N media were shifted to 15N media for 120 or 240 minutes prior to preparation of cell lysate, Cul1p-IP, and analysis by LC-MS/MS.
(d) Relative fractions of newly synthesized FBPs and CSN subunits associated with Cul1p in wildtype and Δknd1 cells. Data represent averages and standard deviations of three independent experiments (see Supplementary Data 4).

