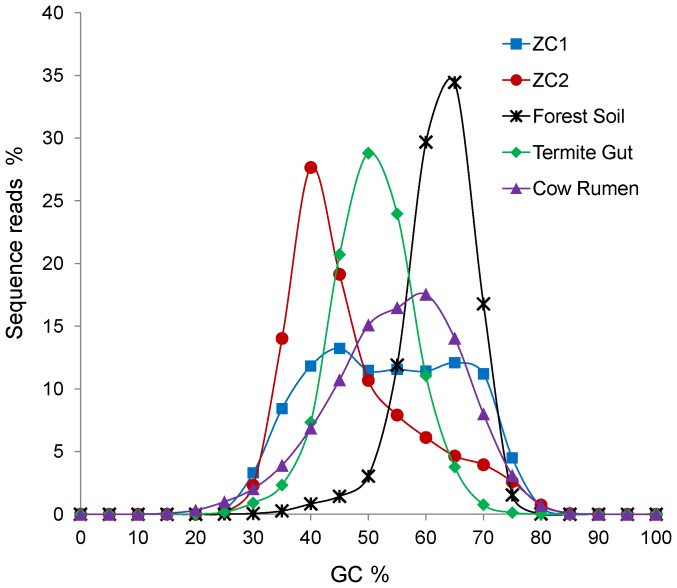
Figure 1. Distribution of the GC content percentage for ZC1 and ZC2 compared with selected metagenomes.
Each position represents the percentage of sequences reads within a GC percentage range. Sources: ZC1 and ZC2 (this work); Luquillo Experimental Forest Soil at Puerto Rico [36]; termite gut [37] and cow rumen pooled planktonic [25] metagenomes were retrieved from MG-RAST.

