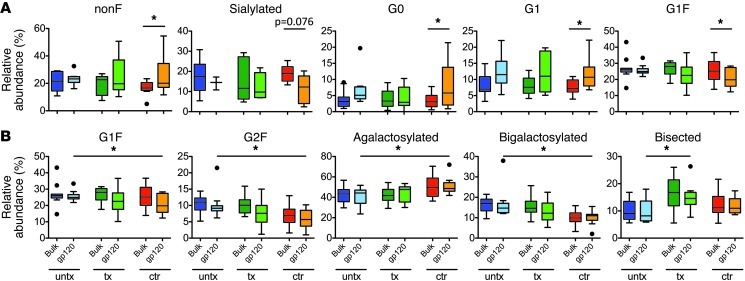
Figure 4. Comparative glycan profiles of bulk plasma and HIV-specific antibodies in each HIV-positive subject class.
(A) Significant differences observed between bulk and HIV-specific antibodies within each subject group. (B) Significant differences observed in HIV-specific antibodies among subject groups. In box-and-whisker plots, horizontal bars indicate the medians, boxes indicate 25th to 75th percentiles, and whiskers indicate 10th and 90th percentiles. Dots outside of box plots represent outliers. *P < 0.05.

