Figure 5.
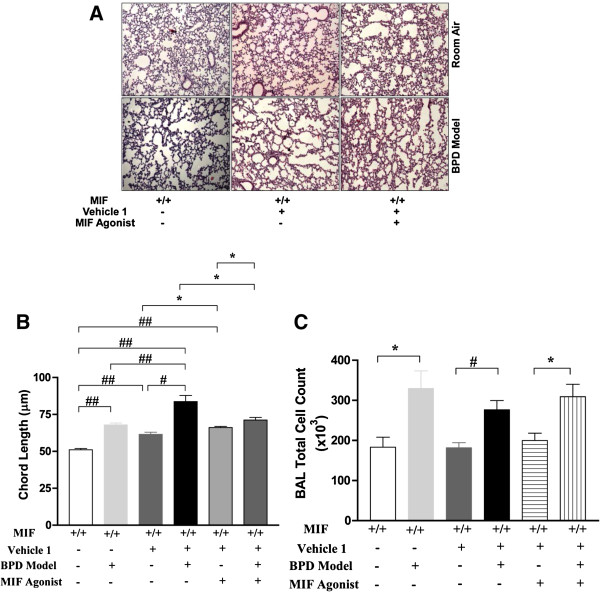
Impact of MIF agonism in the mouse BPD model as reflected by pulmonary phenotype and BAL total cell counts. NB WT control mice were exposed to 100% O2 for PN1-4, with recovery in RA from PN5-14 (BPD model). From PN1-14, some mice were treated with vehicle 1 or the MIF agonist, MIF020 (0.04 mg/g/d; dissolved in vehicle 1). Representative photomicrographs of lung histology (H&E stain) of NB WT mice exposed to RA or hyperoxia (BPD model), or given treatment as noted above, at PN14 (5A). The figures are illustrative of a minimum of 3 animals in each group. Alveolar size, as measured by chord length, confirmed features noted on lung histology (5B). Each bar represents the mean ± SEM of a minimum of three animals. BAL total cell count of NB WT mice exposed to RA or BPD model, or given treatment as noted above, at PN14 (5C). Each bar represents the mean ± SEM of a minimum of three animals. MIF +/+: wild type; MIF −/−: macrophage migration inhibitory factor knock out; BPD Model: bronchopulmonary dysplasia mouse model; Vehicle 1: 10% DMSO; MIF Agonist: MIF020; BAL: bronchoalveolar lavage. ##P<0.0001, #P≤0.01, *P<0.05.

