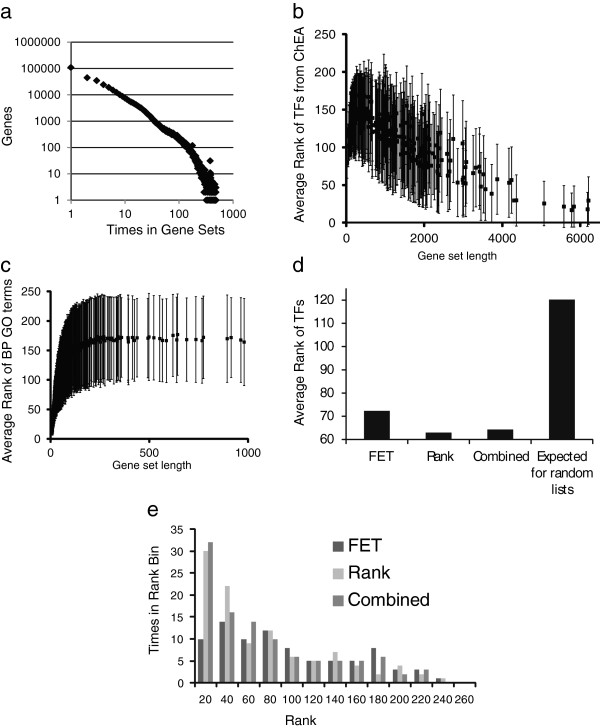
Figure 2.
Validation of enrichment scoring methods. (a) Histogram of overall appearance of genes in gene sets within all the gene-set libraries implemented in Enrichr plotted on a log-log scale; b-c) Random gene lists are used to obtain enrichment analysis ranking using the Fisher exact test. Average ranks with their associated standard deviations are plotted against gene list length from the ChEA gene set library (b) and the GO Biological Process gene-set library (c); d-e) Ranks of specific transcription factors in enrichment analyses using the ChEA gene-set library by the various enrichment analysis scoring methods. Lists of differentially expressed genes after knockdown of the transcription factors with entries in the ChEA gene-set library were used as input; (d) Average rank for those factors comparing the three scoring methods; (e) histogram of cumulative ranks for the three methods.

