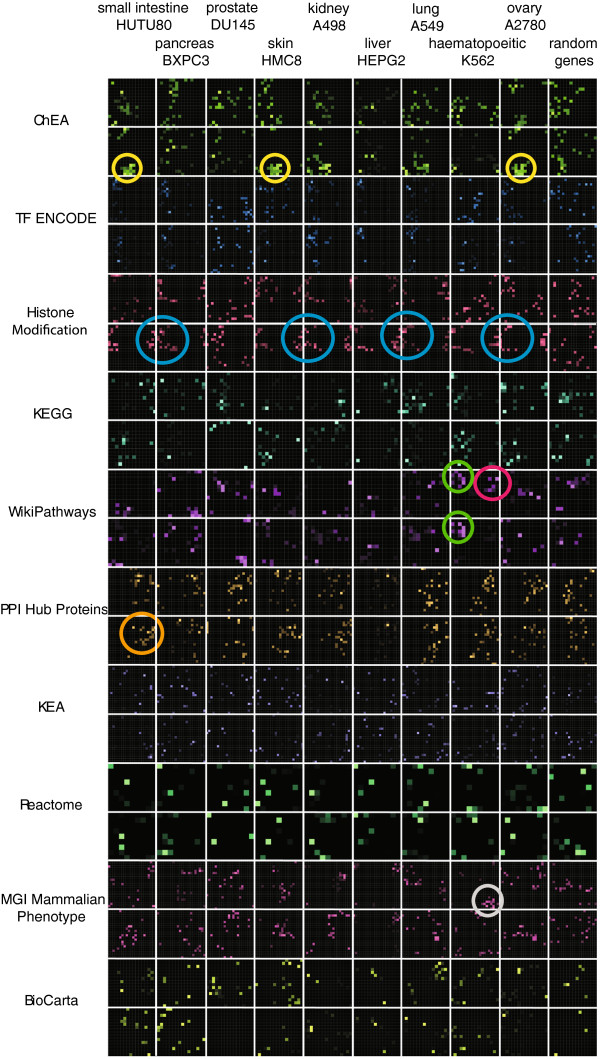
Figure 3.
Global view of signatures created using genes that are highly expressed in cancer cell lines and their matching human tissues. Enriched terms are highlighted on each grid based on the level of significance using various gene-set libraries, each represented by a different color. Circles are used to highlight specific clusters of enriched terms.

