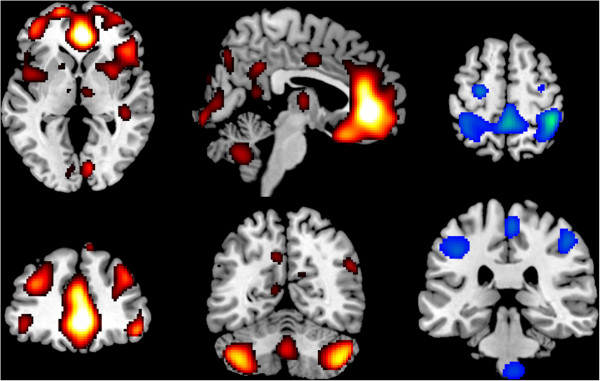
Figure 1.

Patterns of SVM classification analysis. Weights of SVM classification analysis between no CHT and CHT groups overlaid on canonical MNI (Montreal Neurological Institute) brain template. Images are in neurological convention (left is left). In red the positive weights pattern evidenced a prefrontal cerebellar system (PCS) composed primarily by salience network (SN) and secondarily by central executive network (CEN). In blue the negative weights pattern evidence the dorsal attention network (DAN).
