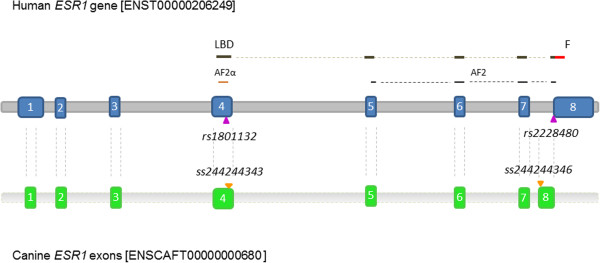
Figure 1.

Schematic illustration of ESR1 alignments relative to the human ESR1 gene sequence. The human ESR1 gene sequence (grey) and exons (blue) with aligned canine ESR1 exons (green) and human and canine polymorphisms (purple and orange triangles, respectively). The exon numbers are in white letters. Bars above the human exon sequences are indicating the location of the ligand binding domain (LBD, dark brown), F domain (F, red bar), activation factor 2α domain (AF2α, light brown bar) and activation factor 2 domain (AF2, black bars). GATA interacts with the AF2 domain [15-19].
