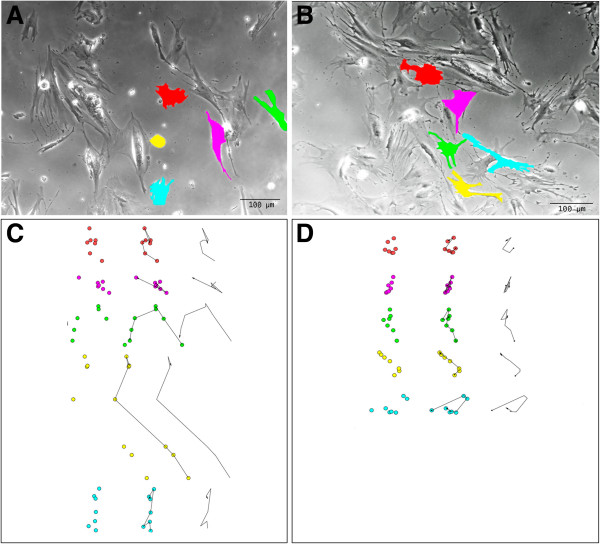
Figure 4.
Motility tracking of fibroblasts from healthy controls (panel A) and celiacs (panel B). In the upper panels the images at the beginning of the movie recording are reported with the cells tracked. In the lower panels the movement of the cell nuclei into the field after 12, 24, 36, 48, 60 and 72 hours are reported with the final trace.

