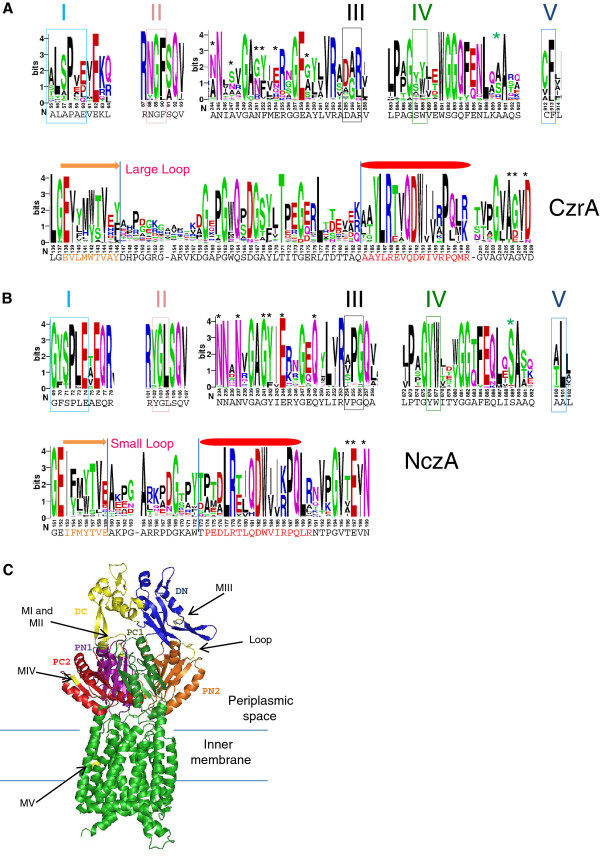
Figure 6.
Motif signatures of the CzrA and NczA orthologous groups and localization on the CzrA structural model. Main differences in the sequence conservation profile between the CzrA (A) and NczA (B) orthologous groups are shown. The boxes show the residues important for the respective motifs and the asterisks show differences in the degree of the amino acid conservation between the two orthologous groups. Protein sequences with more than 55% identity to either CzrA or NczA from C. crescentus NA1000 were used. The figure was generated using the WebLogo server [42], and the height of the residue symbol indicates the degree of conservation within the ortologous groups. The sequence numbering shown below the alignment corresponds to the respective C. crescentus NA1000 proteins. The complete representation of the motifs for the CzrA and NczA orthologous groups are shown in Additional file 2: Figure S1. (C) Cartoon representation of the CzrA structure model in which the conserved motifs MI-MV and the Loop are colored in yellow. The sub-domains DC, DN, PC1, PC2, PN1 and PN2 are colored in yellow, blue, dark green, red, violet and orange, respectively. The CzrA structure model was obtained using the Phyre2 program with CusA structure as a model (PDB: 3 k07, [25]). The structure was generated using PyMOL [43]. The secondary structure elements indicated were predicted using the PHYRE2 program [44]; red ovals and amino acid sequences indicate α-helix; orange arrows and amino acid sequences indicate β-strands.

