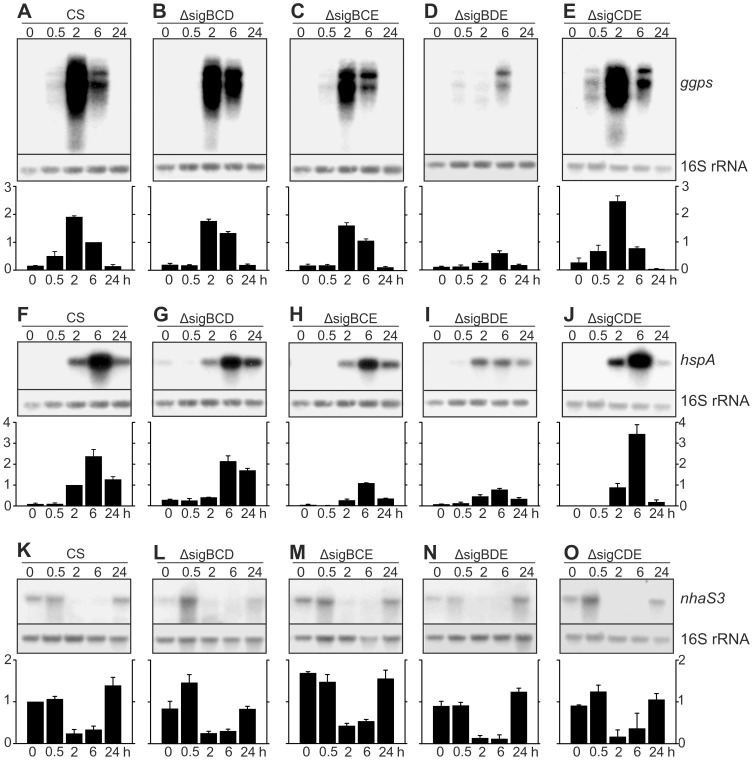
Figure 5. Accumulation of ggpS, hspA and nhaS3 mRNAs during salt acclimation.
Total RNA was isolated after 0, 0.5, 2, 6, and 24 h of treatment with 0.7 M NaCl, and the amounts of ggpS (A–E), hspA (F–J) and nhaS3 (K–O) mRNA were determined by northern blot analysis. Samples containing 5 µg of total RNA were denaturated with glyoxal, and separated on 1.2% agarose gels in phosphate buffer. The gene specific probes were amplified by PCR and labeled with [α-32P] dCTP. Equal loading and even transfer of RNAs were confirmed by re-probing the membrane with a probe recognizing the16S rRNA. Representative northern blots are shown. Autoradiograms were scanned and quantified, and the amount of mRNAs in each sample was corrected according to 16S rRNA. Then data from each autoradiogram was normalized by dividing each sample by the 6-h sample of CS (ggps), 1-h sample of CS (hspA) or the 0-h sample of CS (nhaS3). The bars show the mean from three independent biological replicates, and the error bars denote SE.

