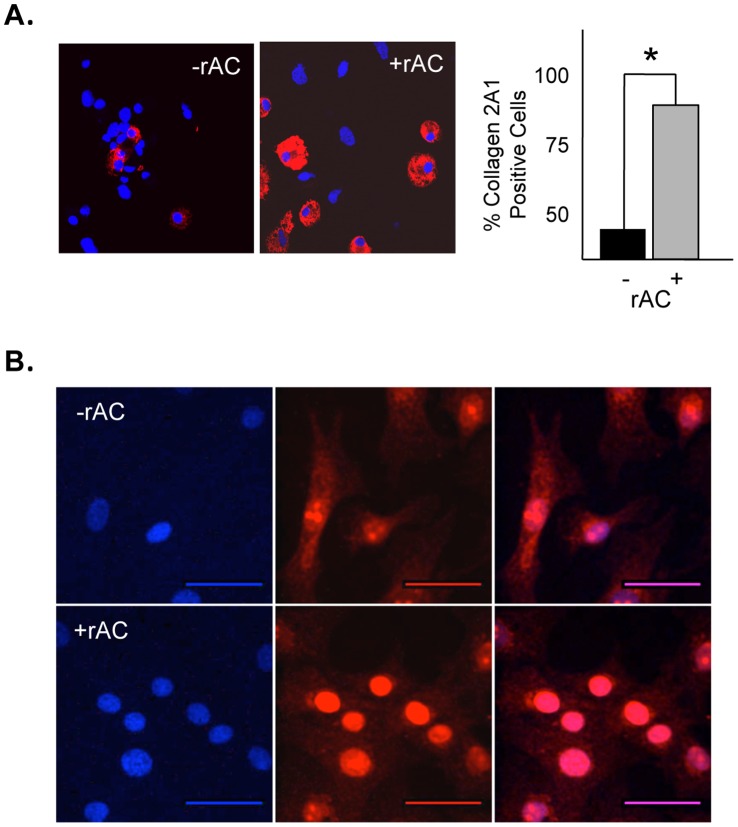
Figure 3. Confocal immunostaining confirming the high level of expression of collagen 2A1 in rat chondrocytes treated with rAC, A) and B) showing different intracellular distribution of Sox9 2 weeks after rAC treatment.
Blue (DAPI) indicates nuclei, and red indicates Sox9 expression. Experiments have been repeated at least 3×. Images are representative from individual experiments. Scale bars: 50 µm. * = p<0.05.

