
Figure 2. Transcript levels for genes within and near to the 16p11.2 rearrangements.
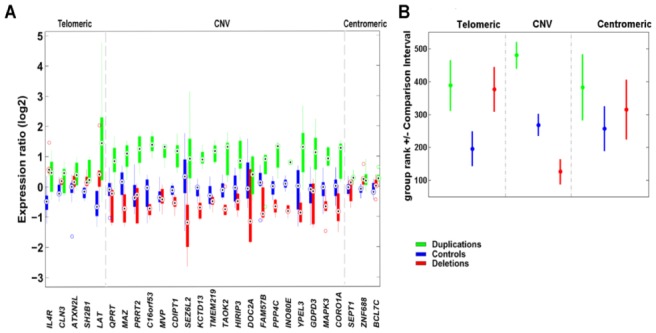
(A) Relative expression levels in boxplot format of 27 genes mapping to 16p11.2 in deletion and duplication carriers (red and green, respectively) and control cell lines (blue). Grey lines denote the extent of the 16p11.2 CNV (29.5–30.1 Mb). Complete lists of genes mapping within the rearranged interval and of the quantitative PCR assays can be consulted in Supplementary Table S1 and S11, respectively. Possible relevance of each of these genes to obesity/leanness and/or developmental delay/cognitive deficits can be consulted in 13.
(B) Rank comparison (Kruskal-Wallis test) between expression of 27 genes mapping to 16p11.2 in deletion and duplication carriers (red and green, respectively) and control cell lines (blue).
Distinction is made between genes mapping telomeric (or centromeric) to the rearranged interval and those within the rearranged interval. Dots correspond to the mean group rank and bars indicate the comparison interval, groups with non-overlapping intervals are significantly different (at α=5%).