
Figure 4.
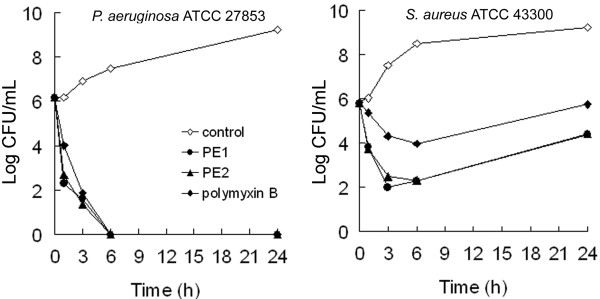
Growth curves of Pseudomonas aeruginosa ATCC 27853 and Staphylococcus aureus ATCC 43300 treated with 4 × MIC peptide antibiotics. The curves are viable cell concentrations plotted against time. In two panels, non-antibiotic control, open diamond; 4 × MIC PE1, filled circle; 4 × MIC PE2, filled triangle; 4 × MIC polymyxin B, filled diamond. For the two strains in the present study, time-kill assays were independently performed 3 times and similar results were obtained. Mean values of the triplicate cfu/mL measurements from a single experiment are plotted.