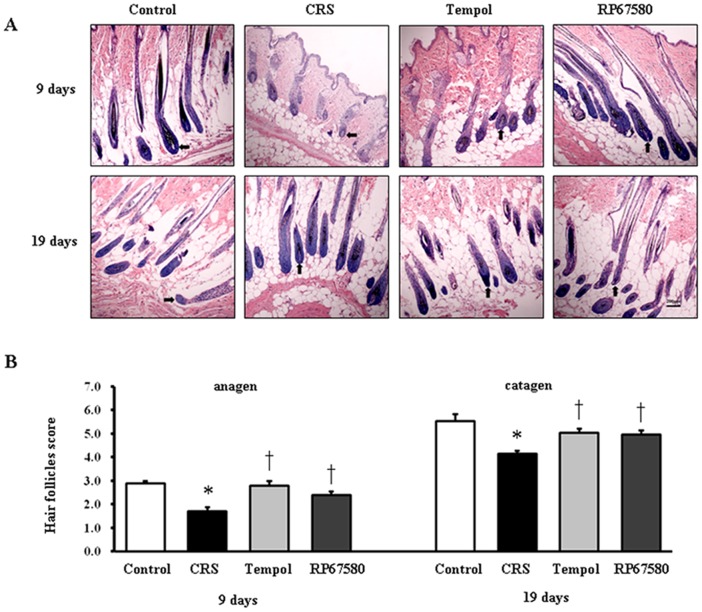
Figure 2. Effects of stress on the hair cycle stage.
A: A representative area of each group on day 9 and day 19 after depilation with the majority of hair follicles. Original magnification was×100. B: The results of hair follicles score for day 9 were shown on the left and the data for day 19 on the right. The Y axis depicted histometric score assessed anagen induction. For each mouse a minimum of 10 individual visual fields were assigned to define hair cycle stages. Data were presented as mean ± SEM, n = 9 in each group, * P<0.05 compared with control group, † P<0.05 compared with CRS group.

