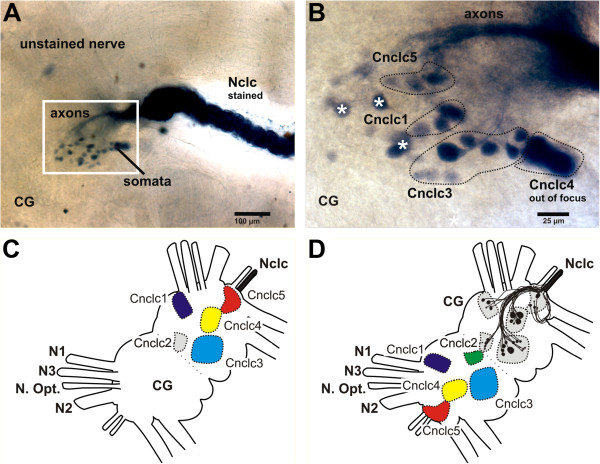
Figure 3.
Scheme for the development of the axonal tracing patterns as shown in Figures 4 , 5 , 6, The first image (A) shows a photograph of part of the right hemisphere of the cerebral ganglion for an axonal tracing of the Nclc of Aplysia punctata. The stained nerve, axons and somata are labeled. B shows a close-up of A and several clusters are indicated. The white asterisks mark somata which are not found in all replicates and the cluster Cnclc2 (see C and D) is not visible here. The schematic in Figure C shows the first step in developing the schematics shown in Figures 4, 5, 6. First the location of the clusters is determined by axonal tracings in several replicates viewed from different angles. After the common position is defined, the clusters are color-coded, and finally in D mirrored to the other hemisphere and the common axonal pathways and somata are added in the original hemisphere. It is important to understand that D is a schematic based on multiple replicates (including B) and that somata which have not been found in all replicates are not shown in D.

