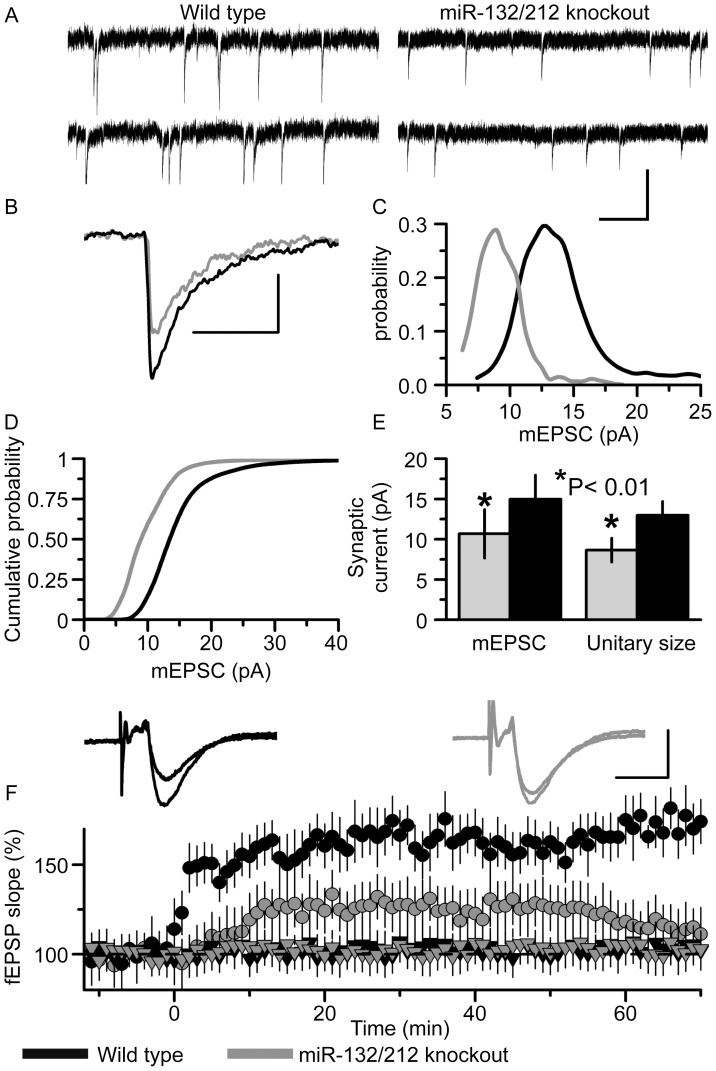
Figure 8. Deletion of miR132/212 influences synaptic transmission and plasticity in the neocortex.
A) Representative examples of miniature spontaneous currents recorded in pyramidal neurons of the somatosensory cortex of a control (fl/fl mice, left panels) and miR-132/212 KO slice (right panels). Whole-cell recording were made at membrane potential of −80 mV in the presence of TTX (1 µM) and picrotoxin (100 µM). Scale bar measures 1 s and 10 pA. B) The superimposition of the average waveform (25 each) of mEPSCs recorded in the fl/fl neuron (black line) and miR-132/212 KO neuron (grey line) shown in A. Scale bar measures 20 ms and 5 pA. C) Superimposition of corresponding amplitude distributions of mEPSCs recorded in the fl/fl neuron (black) and miR-132/212 KO (grey) neuron. The leftward shift in the peak of amplitude distribution of mEPSCs in the KO neuron clearly indicates at decrease in the unitary size of the mEPSCs. D) Cumulative distributions of mEPSCs amplitudes pooled for 7 fl/fl (black line) and 8 miR-132/212 KO neurons (grey line) showing a consistent leftward shift towards reduced mEPSC amplitude in miR-132/212 KO neurons. E) Pooled data of average mEPSC and quantal, unitary size (mean ± SD for 7 fl/fl and 8 KO neurons). The difference in the average amplitude and quantal size between fl/fl and miR KO neurons was statistically significant with p<0.01 (ANOVA). F) Time course of changes in the slope of fEPSPs in layer 2/3 of somatosensory cortex after theta-burst stimulation (5 episodes at 10 s intervals of theta-burst stimulation (5 pulses at 100 Hz, repeated 10 times with 200 ms interval)). Each point represents the mean ± SD for 11 cortical slices of fl/fl mice (black circles) and 14 cortical slices of miR-132/212 KO mice (grey circles). The insets show the average fEPSP (20 each) waveforms recorded before (smaller of the two traces) and 60 min after theta-burst stimulation (larger of the two traces) in cortical slices of fl/fl (black lines) and miR-132/212 KO (grey lines) mice. The black and grey triangles hovering at 100% refer to the slope of fEPSPs from a simultaneously-recorded control pathway for fl/fl and KO slices, respectively. Long-term potentiation of excitatory synaptic transmission is impaired in the neocortex of miR-132/212 KO mice. Scale bar measures 5 ms and 1 mV.

