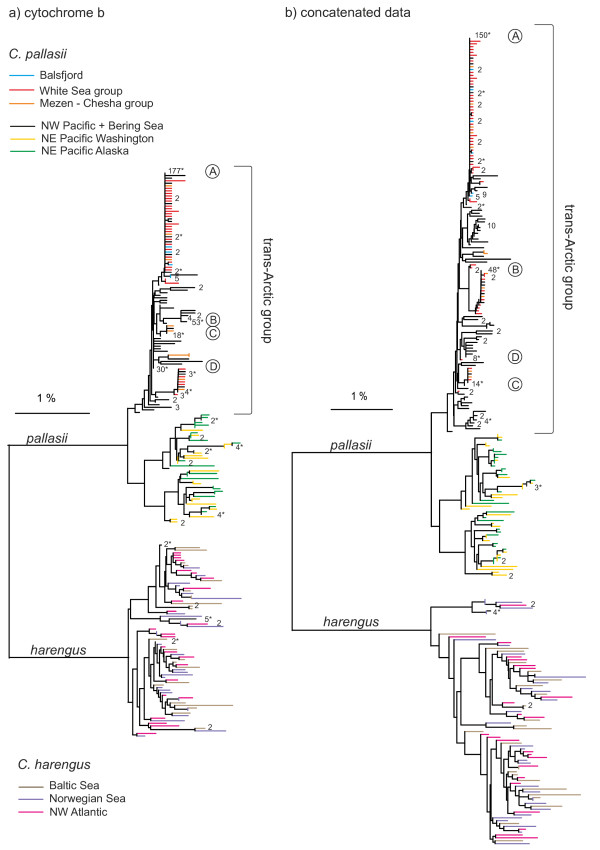
Figure 2.
Mitochondrial diversity in two herring species. Neighbor-joining trees from GTR+I+Γ distances (a) from cyt-b data only (1131 bp) (b) from concatenated cyt-b+CR data (1617 bp). The numbers are observed frequencies of haplotypes found in multiple individuals; haplotypes shared between localities are indicated with asterisks. Color codes refer to population groups as in Figure 1, core haplotypes A-D as in Figure 3.

