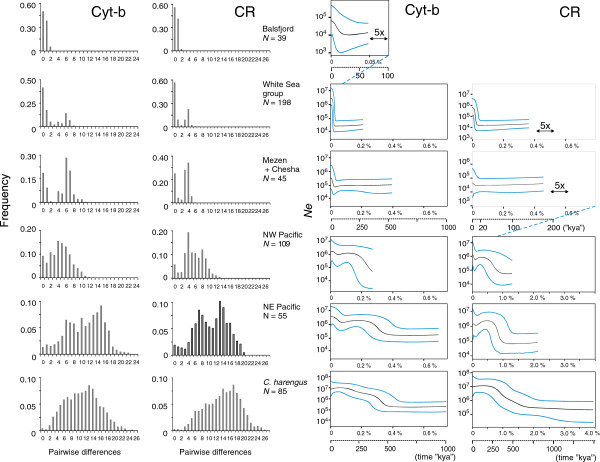
Figure 5.
Mismatch distributions and Bayesian skyline (BSL) plots reflect population size history. Mismatch data in the two left panels, BSL plots in the two panels to the right. Results are presented for various putatively demographically coherent subsets of the data, for the cyt-b and CR data separately. Divergence and age estimates of inferred demographic events evaluated from these plots are presented in Additional file 3: Table S1. The BSL scales for Ne (y-axis) and operational timescales (x-axis) are based on 0.75% My-1 (cyt-b) and 2.7% My-1 (CR) per site mutation rates and a 4-year generation interval (see Additional file 1). Black lines are median estimates of Ne, blue lines are the 95% HPD limits. End points of the lines represent the median estimate of the basal coalescence.

