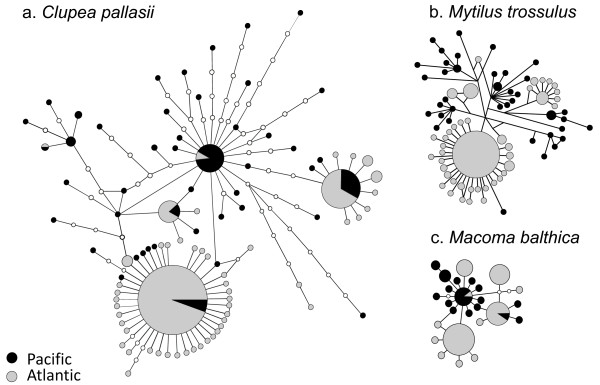
Figure 6.

Comparison of mitochondrial haplotype networks of trans-Arctic clades for three zoogeographically analogous amphi-boreal taxa. (a) 99% statistical parsimony network of the trans-Arctic Clupea pallasii lineage (cyt-b data only). (b) Median-joining network of Mytilus trossulus (control region; redrawn from [6]).The branch lengths correspond to the number of substitutions but unobserved haplotypes are not marked here (c) 99% statistical parsimony network of Macoma balthica (COIII gene; [5]). Note the similar trans-Arctic distributions and signatures of expansion in the dominant Atlantic haplotypes.
