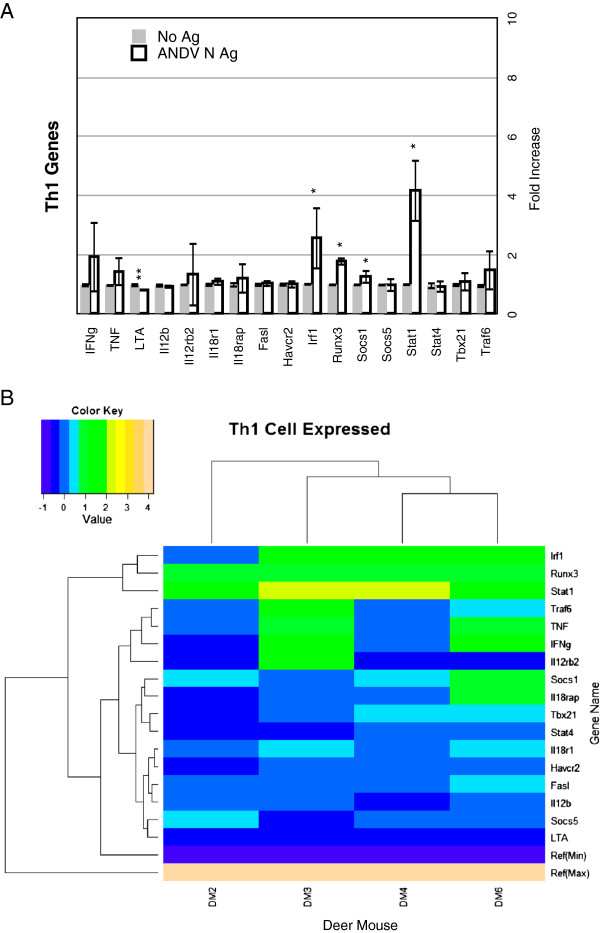
Figure 3.
Th1 gene expression. A. Bars on the graphs represent the group mean ΔΔCt values. Grey bars are the lymphocyte cultures without antigen and the white bars are the lymphocyte cultures with antigen. The error bars represent the 95% confidence intervals, thus if the error bars do not overlap for a given gene, the gene is significantly upregulated (*) or downregulated (**). B. The heat map indicates expression levels of genes from the four deer mice used in this study (DM2, DM3, DM4, DM6). Logfold-changes (“Value”) in the Color Key legend indicate changes in expression. Dendrograms represent deer mouse lymph node cell clusters (top) or gene expression clusters (left).

