
Figure 2.
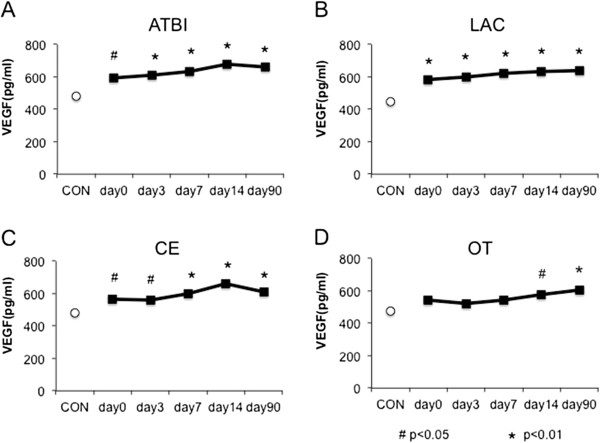
Temporal profile of plasma VEGF levels in each stroke subtype from day 0 to day 90, A) ATBI, B) LAC, C) CE, D) OT. Data are expressed as mean ± SEM. *P < 0.01 vs. control, #P < 0.05 vs. control.
Official websites use .gov
A
.gov website belongs to an official
government organization in the United States.
Secure .gov websites use HTTPS
A lock (
) or https:// means you've safely
connected to the .gov website. Share sensitive
information only on official, secure websites.
Temporal profile of plasma VEGF levels in each stroke subtype from day 0 to day 90, A) ATBI, B) LAC, C) CE, D) OT. Data are expressed as mean ± SEM. *P < 0.01 vs. control, #P < 0.05 vs. control.