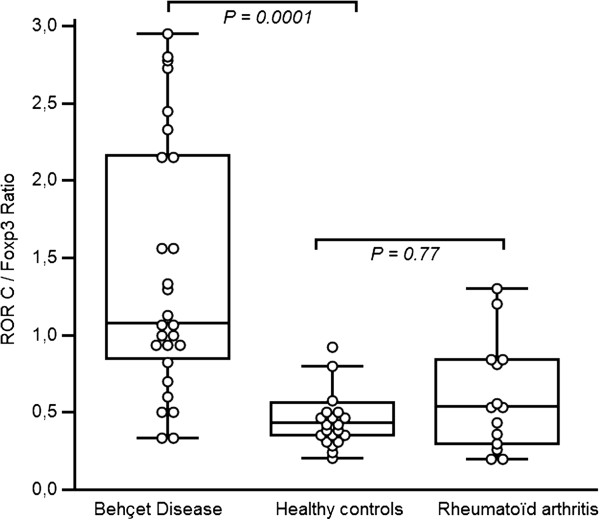
Figure 1.
Transcription factor ratios in BAL cells. Values were expressed as mean ± SD in the text. P is indicated in the Figure. Data are shown as box plots. Each box represents the 25th to 75th percentiles. Lines inside the boxes represent the mean. Whiskers represent the 10th and the 90th percentiles.

