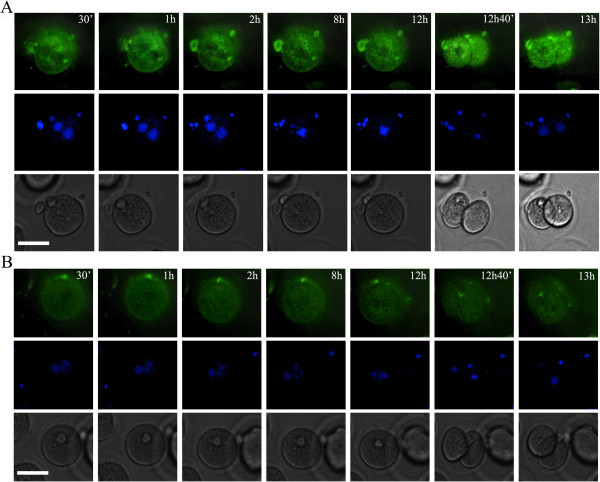
Figure 5.
ER redistribution was disrupted during development of early embryos in diabetic mice. Time-lapse phase contrast microscopy (bottom row), ER tracker stained ER (top row) and Hoechst-stained chromosomes (middle row) of developing embryos from control mice (A) or diabetic mice (B). Times are indicated in the upper right corner. The scale bars represent 10 μm.

