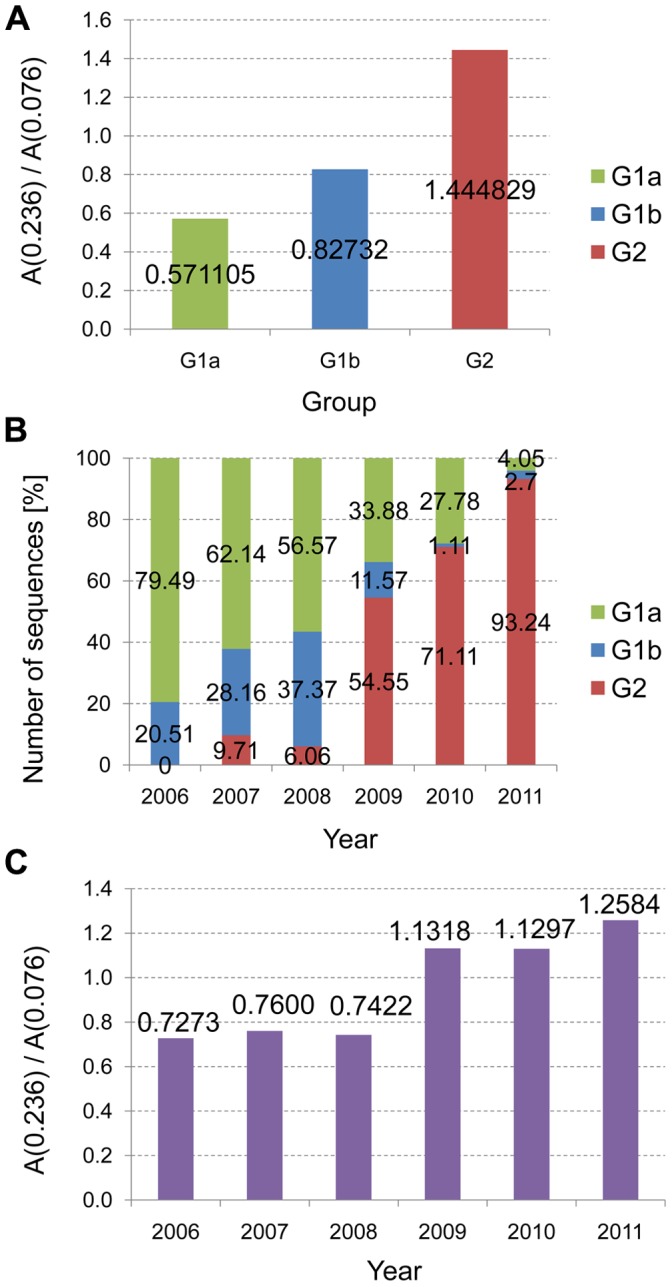
Figure 4. Distribution of A(0.236)/A(0.076) ratios by years for Egyptian H5N1-HPAIV isolated during 2006–2011.

(a) The average values of A(0.236)/A(0.076) for G1 and G2 viruses. (b) Distribution of G1 and G2 viruses by years. (c) The average values of A(0.236)/A(0.076) by years.
