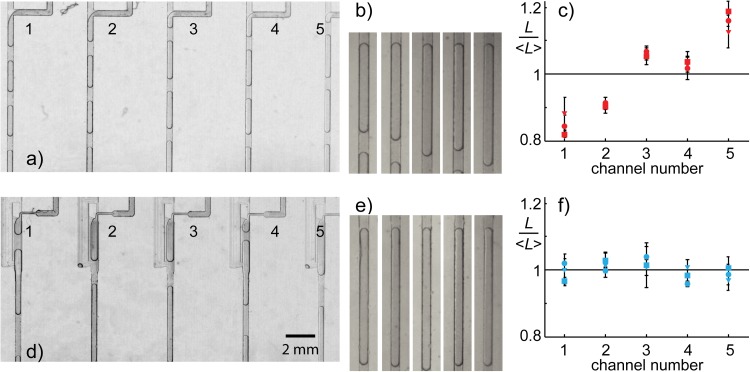
Figure 6.
Comparison between droplets produced in parallel at T-junctions (a)–(c) and fixed-volume droplet generators (d)–(f). Unequal flow distribution to the five junctions results in unequal sized droplets when using T-junctions, whereas the size is nearly the same when using fixed-volume droplet generators. The error bars indicate the standard deviation obtained by measuring the length of at least 10 droplets. Conditions: and (circles and micrographs), (squares), (triangles). In the case of , frequencies of generation of droplets in succeeding channels were: f = (0.46, 0.45, 0.45, 0.46, 0.46) s−1 for T-junctions, f = (0.35, 0.35, 0.37, 0.36, 0.36) s−1 for fixed-volume droplet generators; volume fractions estimated as = (0.82, 0.81, 0.85, 0.85, 0.86) for T-junctions, ϕ = (0.83, 0.86, 0.85, 0.84, 0.85) for fixed-volume droplet generators. A detailed design of the devices is provided in the supplementary material.11

