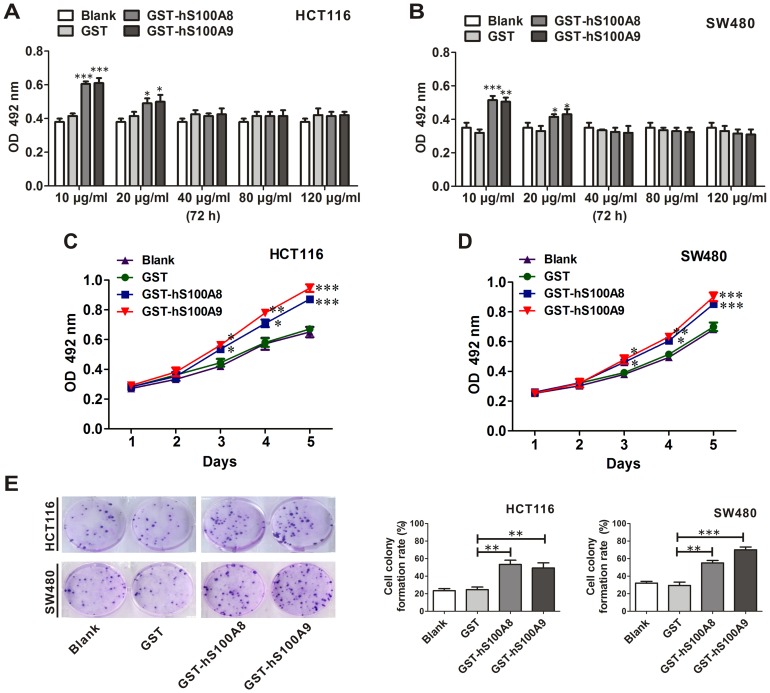
Figure 2. The influence of recombinant S100A8 and S100A9 proteins on the viability of CRC cells.
(A) HCT116 and (B) SW480 cells were treated with and without GST, GST-hS100A8 and GST-hS100A9 at different concentrations for 72 h, and cell viability was measured using the MTT assay. Results are expressed as the mean absorbances ± SEM of three independent experiments. * p<0.05, ** p<0.01 and *** p<0.001, all vs. GST control. (C) HCT116 and (D) SW480 cells were treated with and without GST (10 µg/ml), GST-hS100A8 (10 µg/ml) and GST-hS100A9 (10 µg/ml) for continuous five days in medium containing 1% FBS. Cell viability was measured using the MTT assay. Results are expressed as the mean absorbances ± SEM of three independent experiments. * p<0.05, ** p<0.01 and *** p<0.001, all vs. GST control. (E) HCT116 cells and SW480 cells were seeded in a 6-well tissue culture plate, and treated with and without GST (10 µg/ml), GST-hS100A8 (10 µg/ml) or GST-hS100A9 (10 µg/ml) for two weeks for the analysis of colony forming ability. The representative images of the colony-forming units are shown in the left panel, and colony-forming rates for each group are quantified in the middle (HCT116) and right (SW480) panels. The colony-forming rate was obtained as: (colony number/seeded cell number)×100%. The experiment was repeated thrice. ** p<0.01 and *** p<0.001, GST-hS100A8 or GST-hS100A9 vs. GST control.

